
Process behavior charts and histograms with specification limits superimposed allow us to compare the voice of the process with the voice of the customer. Numerical summaries (this is how process capability indexes should be described) complement these graphical comparisons, but they are not able to replace them. The main problem with numerical summaries is not the calculations themselves, but their proper interpretation. The key to using any index is understanding its limitations.
How often have you seen reports containing a statement such as: The process Cpk is – e.g., 1.24? What questions should you ask before drawing any conclusions?
- Was the measurement system that provided the data used for the calculations verified and sufficiently precise? (Was an MSA conducted and was it done correctly?)
- How were the data collected? Do they come from a rational sampling plan that reflects the sources of variation present in this process on a daily basis?
- Is the process stable? Do we have only common cause variation? Remember: first stability, then capability.
- Are the specifications reliably defined?
- Are the data normally distributed?
- How much data were used to calculate the variation indexes?
Assuming positive answers to questions 1 through 5, let us pause at question 6.
Cpk = 1.24. In most cases, such a statement is based on data from a sample taken from a much larger population. Variation exists! This means that if we collected data again from the same process, in the same way, and recalculated the Cpk index, its value would most likely be different from 1.24.
When we report Cpk = 1.24, the recipient may assume that this is the true value of Cpk – but it is not. 1.24 is only an estimate. A better way of reporting would be:
“I do not know the true value of Cpk, but based on a sample of size n = 30, I am 95% confident that it lies between 0.90 and 1.58.”
Statistics are only estimates of the truth and, therefore, are subject to error. The magnitude of the error of an index depends on:
- sample size from which the statistic was calculated,
- the confidence level we want to assign to the statistic.
A confidence level, e.g., 95%, means that if I repeatedly take samples from the same process in the same way and each time determine a new 95% confidence interval, then in 95% of cases the newly determined interval will contain the true value of the index – 5% will not.
If we consider that a poor Cpk level is below 1.00 and a very good level is above 1.33, then the interval from 0.90 to 1.58 is practically useless from an informational standpoint. Where is the problem? The sample is too small or in other words, the amount of data used to calculate Cpk is too small.
How do we calculate the confidence interval for Cpk?
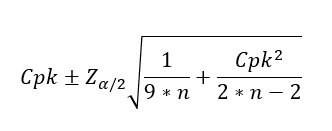
where:
- Cpk – the current estimate of the index,
- n – the number of data points used in the calculation,
- Zα/2 – a constant for the level of confidence. It is the value for which the area under the Gaussian curve on one side equals α/2.
To determine it, for example, for a 95% confidence level:
- find α; 95% = 0.95, therefore α = 1 − 0.95 = 0.05
- find α/2 = 0.05/2; α/2 = 0.025
- find 1 − α/2; 1 − α/2 = 1 − 0.025 = 0.975
- find Zα/2 for 1 − α/2 in the normal distribution tables. In the tables we find the value 0.975 and read the Z value, which in this case is 1.96
Table 1 presents Zα/2 values for the most commonly used confidence intervals.
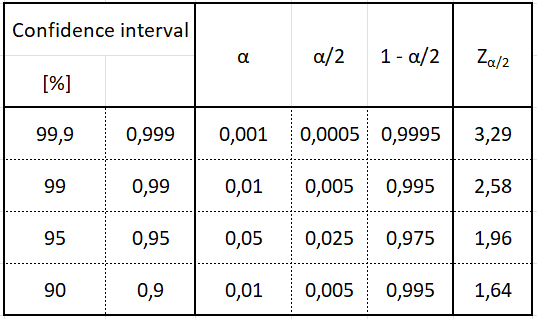
Table 1
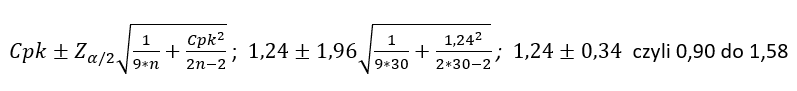
Back to our example:
- Cpk = 1,24
- n =30
- Zα/2 =1,96
How much data do we need? Let us calculate how the confidence interval for Cpk = 1.24 changes for different subgroup sizes. Table 2 below shows the calculation results:
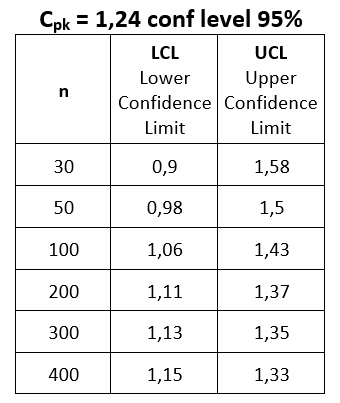
Table 2
If we want to be confident that Cpk will not fall below 1, we need at least 100 observations. Depending on the level of certainty we require, we should define the Lower Confidence Limit rather than only the desired Cpk value.
Modifying the initial statement: “I do not know the true value of Cpk, but based on a sample of size n = 30, I am 95% confident that it will not be lower than 0.90”.
The greater the amount of data, the narrower the confidence interval. In general practice, there are two standards for the desired Cpk level: 1.67 for characteristics considered critical and 1.33 for the others. Let us see how the LCL levels are shaped for these two values depending on the amount of data used in their calculation.
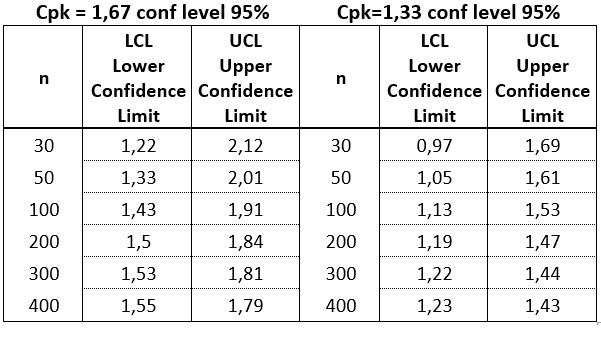
Table 3
So how much data do we need to calculate capability indexes? In most practical applications, we are not interested in how high Cpk is, but whether it does not fall below a certain threshold value. In such cases, we should be interested in the Lower Confidence Limit rather than the currently calculated value of the index.
The amount of data used in the calculations is a significant limitation of capability indexes. Does this mean the index is bad? No. Every statistical method, every index has limitations. Only by understanding them can we use them in a way that brings real benefits.
An Excel file that calculates LCL and UCL levels for a given confidence level, sample size, and currently estimated Cpk level is at your disposal.
Source:
Donald J. Wheeler, Beyond Capability Confusion, 2nd edition, SPC Press
Mark L. Crossley, Size Matters, How good is your Cpk, really?, Quality Digest Magazine, 2000.1