

The fence panel manufacturer had a problem with excessively high variation in enamel coating thickness. The five-year anti-corrosion warranty offered to customers requires ensuring a minimum coating thickness of 80 microns, confirmed by salt spray chamber tests. High variation in thickness within the manufactured panels results in significantly higher consumption of enamel powder than assumed at the product development and cost calculation stage. The average coating thickness was almost twice the required minimum thickness.
How does the process work? The input material consists of raw panels, which after surface preparation in the degreasing process are electrostatically coated with powder in the enameling booth.
The panels enter the enameling booth suspended on crossbars. Each crossbar has three hooks: left: 1, middle: 2, and right: 3 – thus one crossbar = 3 panels. The crossbars enter one after another at a maximum speed set by the operator, at which they are able to maintain the minimum required thickness. On both the left and right side of the enameling booth (which can be imagined as a tunnel), four pairs of enameling guns operate, moving up and down. The guns are responsible for transporting the powder, which is to be “sprayed” onto the panels. The portion of powder that is deposited on the parts will be cured in the next operation in the oven. The remainder is “vacuumed” off using a special exhaust system to reduce the level of contamination inside the machine. This is schematically shown in the figure below.
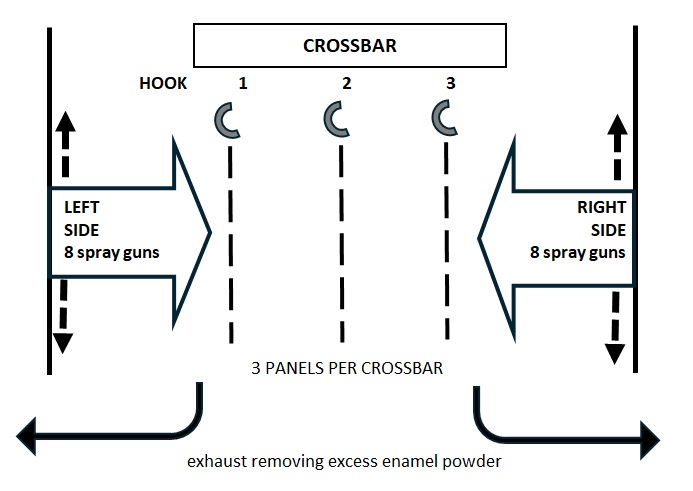
Fig. 1. Enameling booth
In daily production, panel thickness is checked every hour. Three panels are measured at multiple points across the entire surface on both sides. A program specially created for this purpose calculates statistics on the basis of which the operator must decide whether correction of the gun parameters used for powder application is required. The decision whether to reduce or increase coating thickness is made based on requirements concerning:
- minimum average from multiple thickness measurements
- no measurements below the required minimum
- allowable number of measurements slightly exceeding the required minimum thickness
Depending on the inspection result, the process remains unchanged or the parameters of the enameling guns are modified.
The first stage of the project was verification of the measurement system, which confirmed its sufficient precision.
The next step, aimed at assessing the range of thickness variation in the panels without the daily adjustments made by operators, was a “small” sampling, shown schematically below.
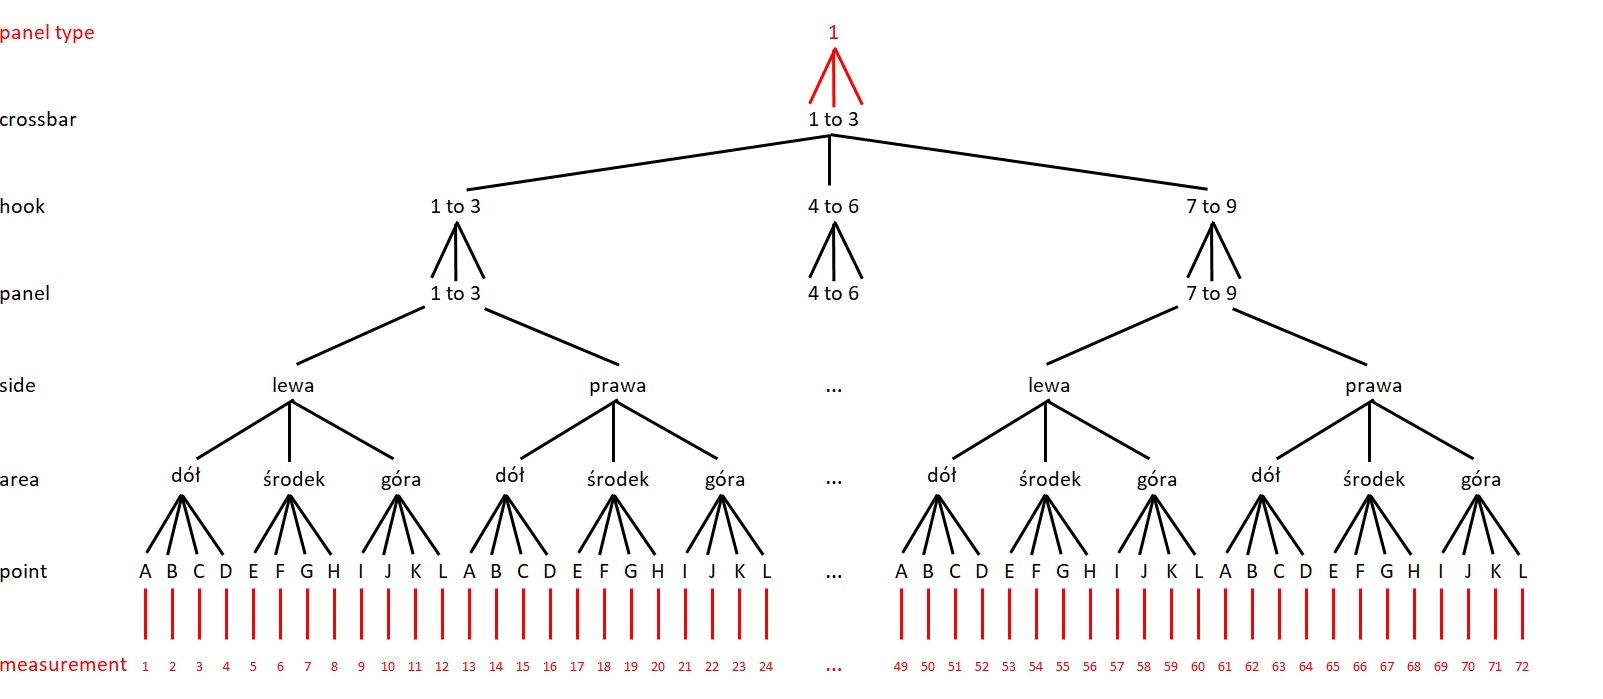
We collected panels from three consecutive crossbars, one after another. This resulted in a total of nine panels, of which three came from the left hook (panel 1, 4, 7), three from the middle hook (panel 2, 5, 8), and three from the right hook (panel 3, 6, 9). Each panel was measured on its “left” and “right” side at predefined and always the same 12 points, as shown in Fig. 2.
Panel sides were marked according to the orientation of the panels in the enameling booth, as shown in Fig. 1.
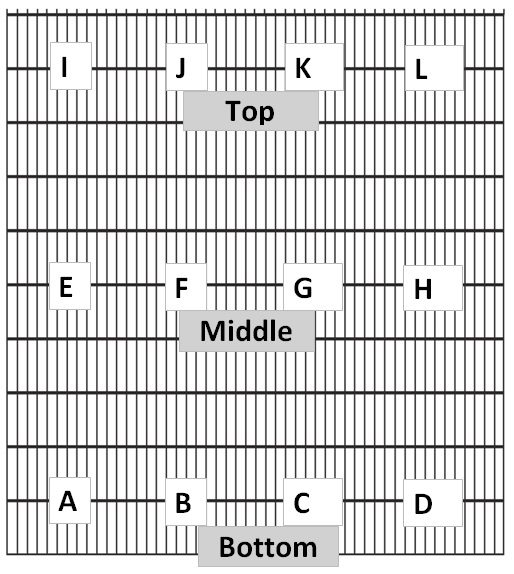
Fig. 2. Marking of locations on the panel
Points A–D correspond to the bottom of the panel (low in the enameling booth), points E–H to its middle section, and points I–L to the top of the panel (closest to the crossbar).
In total, each of the 9 panels was measured at 12 points on each side (left and right), resulting in 24 measurements per panel and a total of 216 measurements. The results are shown in the chart below.
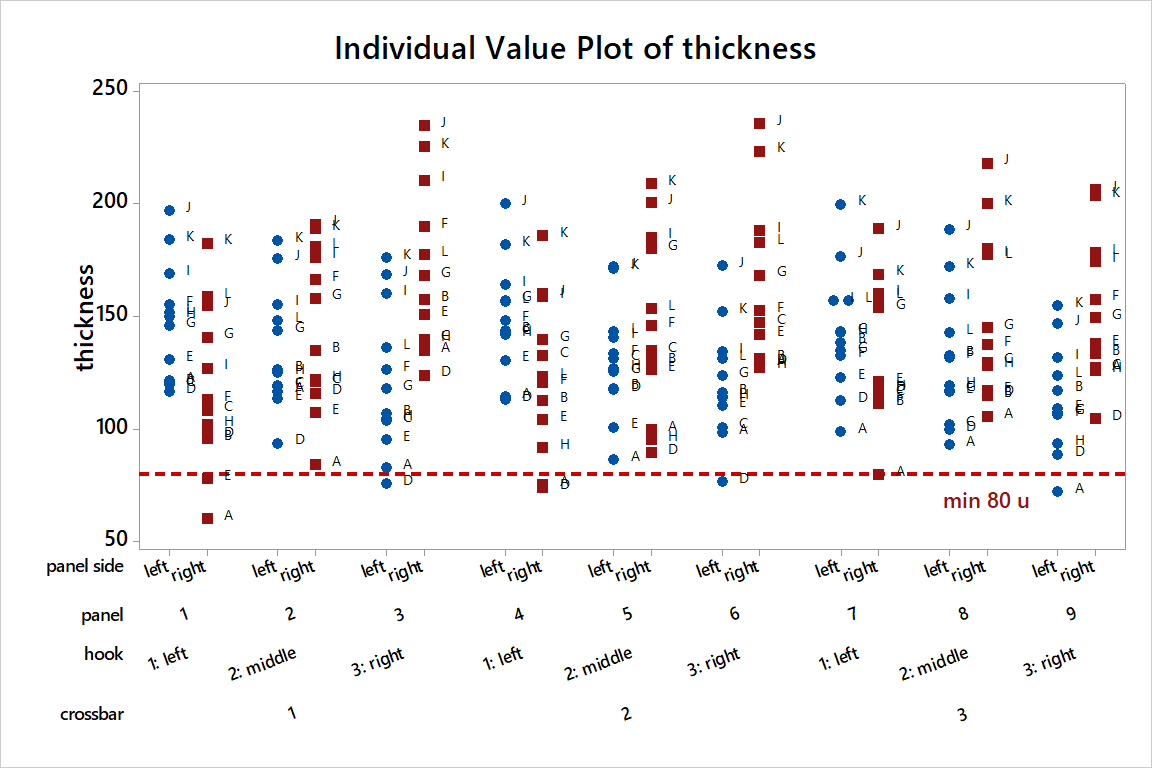
Chart 1
Despite collecting 9 consecutive panels from immediately successive crossbars, the variation in thickness is enormous, ranging from 60 to 236 microns. The amount of enamel powder required to meet the minimum requirement under such variation is indeed a problem. Any reduction of this range will bring real and immediate savings.
We also see that successive crossbars and panels do not differ from one another, and there are no differences between sides either. The dominant source of variation is variation within the panel (variation between locations A to L). Let us therefore plot the same data, but with respect to the locations within the panel.
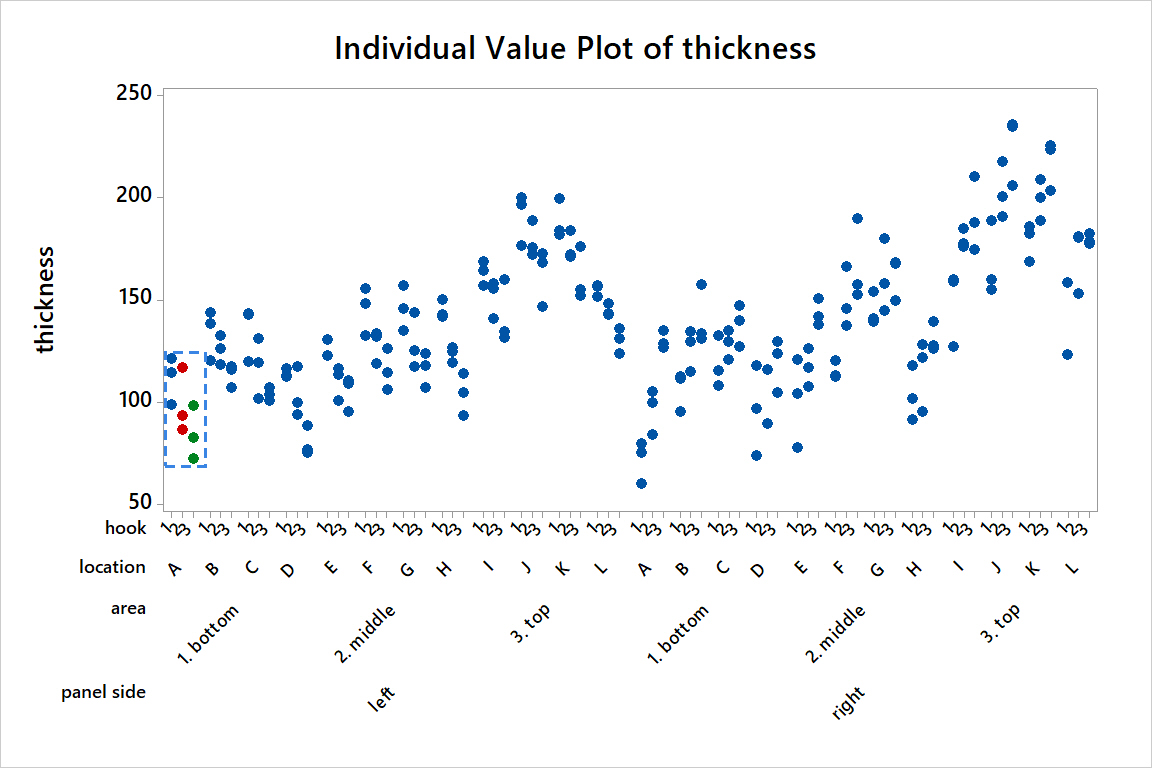
Chart 2
To understand the analysis that follows, it is necessary to understand how the thickness measurement results are plotted in Chart 2, because this view will be used to obtain the final conclusions.
- The first three blue dots on the left (within the blue box) represent thickness measurement results for three panels taken from hook 1 (from three consecutive crossbars), measured at point A on the left side of the panel, where point A is located in the lower area of the panel.
- The three red dots represent coating thickness at point A on the left side measured for three panels from the middle hook.
- Analogously, the green dots represent results at the same point for three panels taken from the third hook, i.e. the one on the right side.
- At the same time, the height of the blue box shows the variation of enamel thickness at point A on the left side, and its position shows the average thickness at that point.
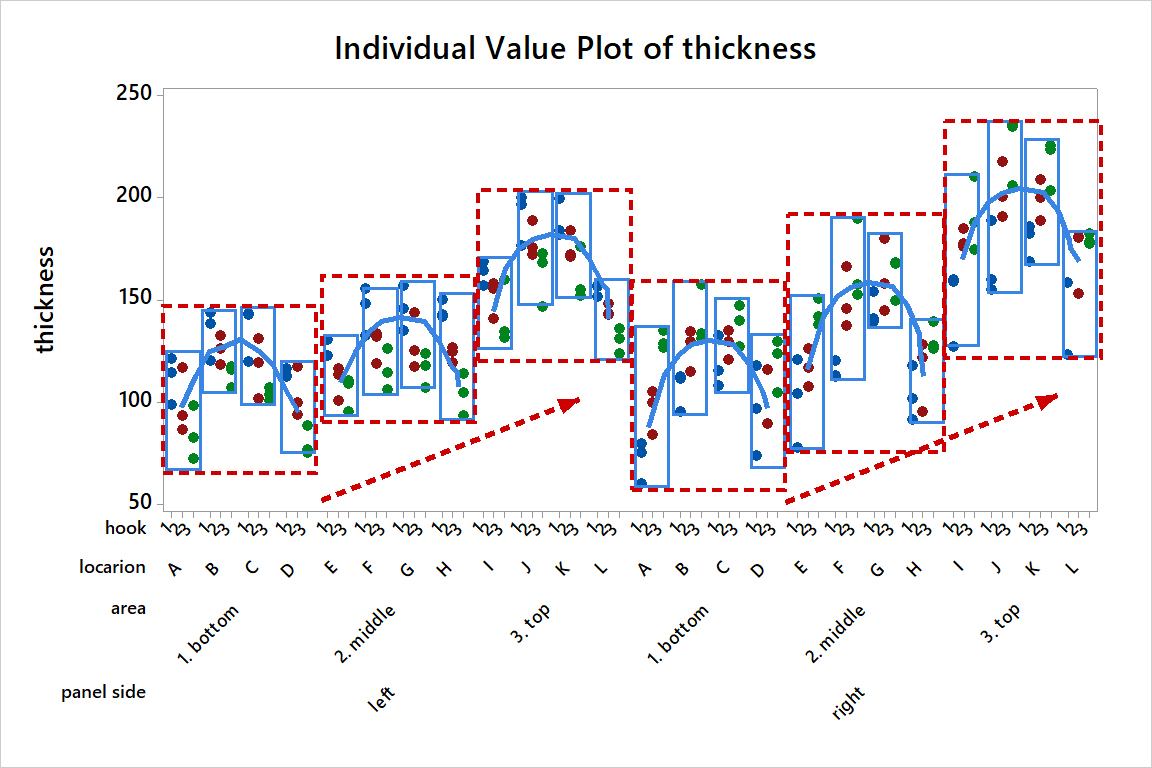
Chart 3
Chart 3 shows two systematic effects:
- Area-to-area effect: coating thickness increases from the bottom to the top of the panel (red arrow)
- Location-to-location effect: the inner wires of the panel have greater thickness than the outer ones (blue arc)
Both effects are also shown in Fig. 3.
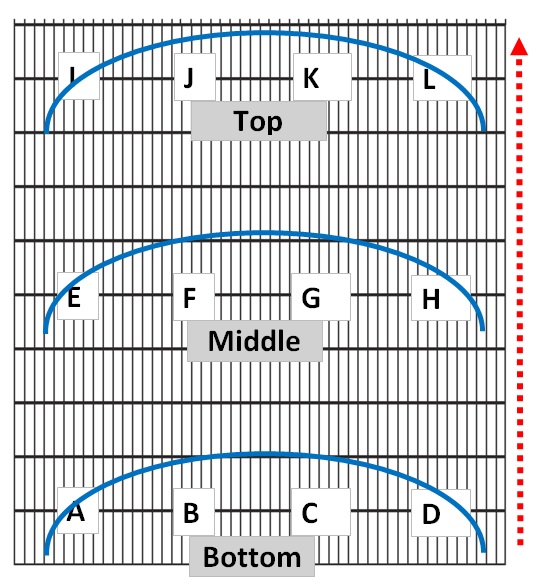
Fig. 3
Most often, in order to establish cause-and-effect relationships and reduce variation, experimentation is required. An exception is a situation like this one. Usually, people familiar with the product and the process, when provided with information about the occurrence of such systematic effects, are able to link them to specific causes. And so:
- The area-to-area variation effect, i.e. the fact that thickness is lowest at the bottom of the enameling booth and increases with height, was linked to the exhaust collecting powder that did not fall to the bottom of the booth being set to maximum power. The reason for this setting was the reduction of downtime caused by the need to clean the booth. Reducing the exhaust power completely eliminated this effect.
- The location-to-location variation effect, i.e. the fact that thickness changes across the width of the panel, was linked to the amplitude of the guns. In simple terms: due to changes in speed, the guns often did not perform a full number of up-and-down cycles for successive crossbars. The arc visible in Fig. 3 changed over time; if we had collected panels on a different day it would probably have been curved differently, but certainly repeatable within consecutive crossbars. Equalizing the amplitude so that each crossbar encountered two full up-and-down movements from all guns completely eliminated this effect.
Chart 4 shows that we have yet a third systematic effect for the same data.
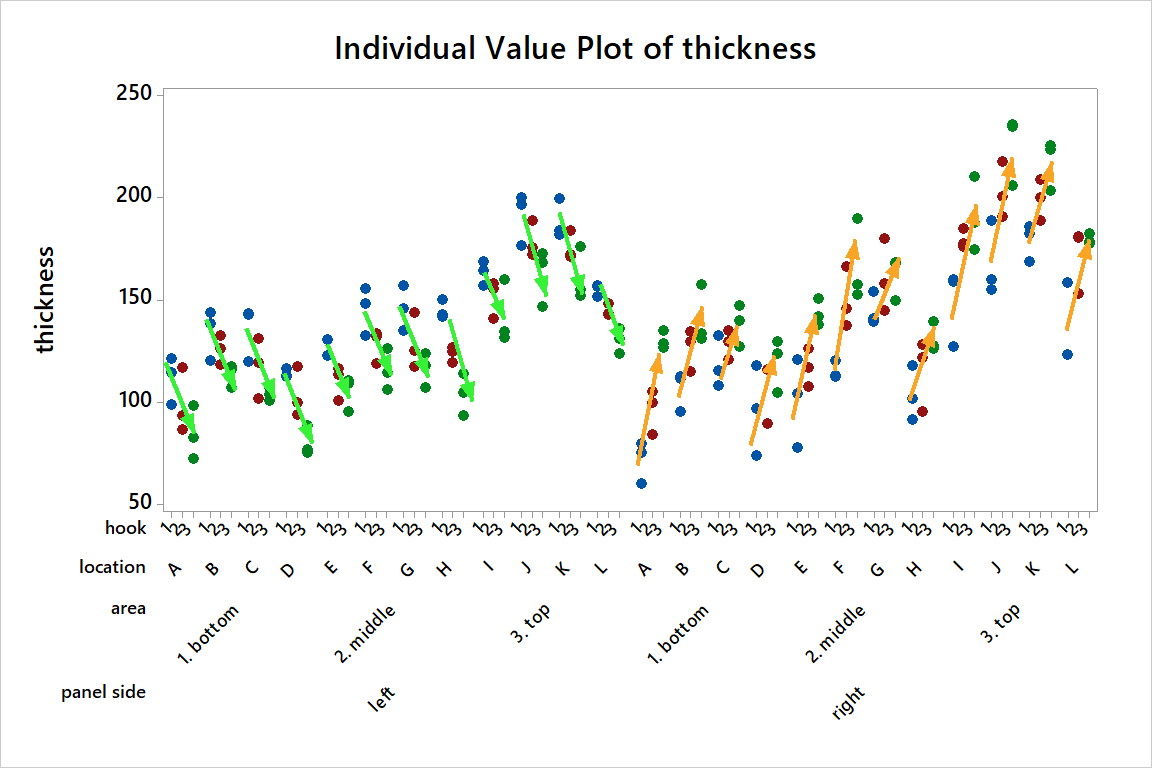
Chart 4
Effect 3: hook-to-hook: panels measured at a given point on the left side always show the trend indicated by the green arrow. Panels from hook 1 have the highest result, the middle hook shows medium values, and those from the right hook the lowest. This effect appears in the opposite direction, as shown by the orange arrow, when the panel is measured on the right side.
This effect was not surprising; it is related to the fact that in electrostatic attraction between powder and panel, in addition to the potential difference, distance is also important. The guns operating on the left side of the booth are closest to the panels suspended on hook 1, where thickness is highest; analogously for the guns operating on the right side. This is shown in Fig. 4.
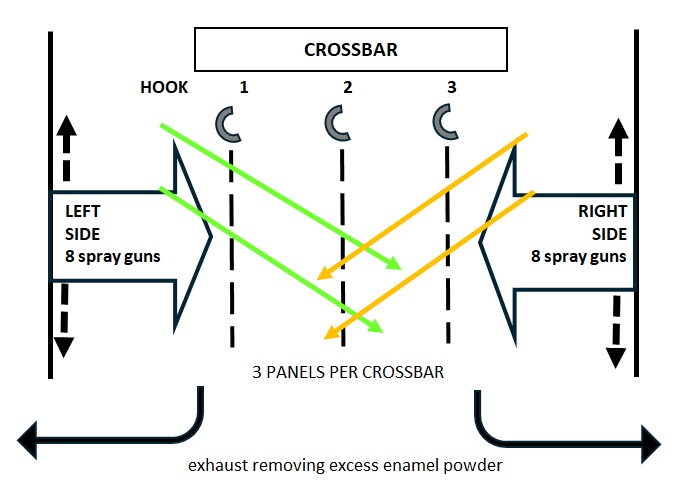
Fig. 4
There is nothing we can do about this effect, because this is how the process is organized.
After introducing changes to exhaust power and gun amplitude, data were collected in the same way: 9 panels from three consecutive crossbars measured on both sides at 12 points. The results and their comparison with the original measurements are shown in Chart 5.
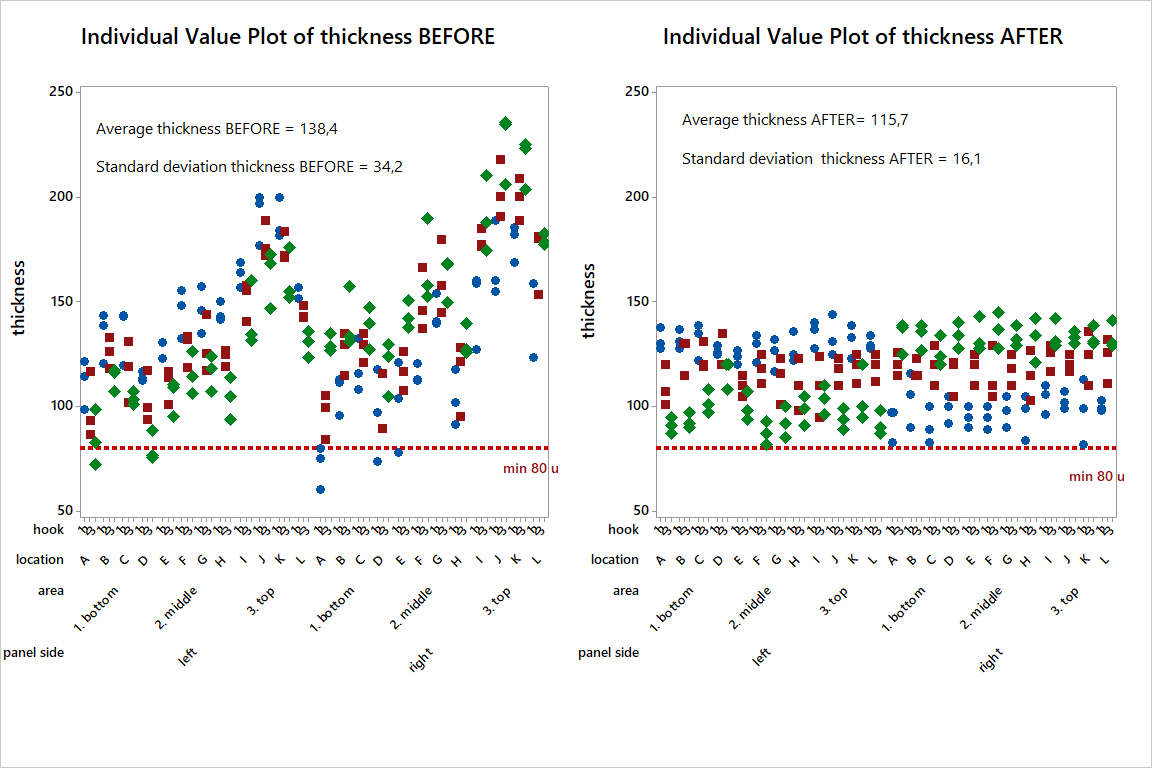
Chart 5
Of the three systematic effects, only the one resulting from the gun-to-panel distance, i.e. hook-to-hook, remained. Eliminating the causes of the other two made it possible to reduce variation by half, and thus to lower the average thickness while maintaining the required minimum panel thickness. The reduction in enamel powder consumption can be counted in tens of tons per year, and annual savings in hundreds of thousands of PLN.
Sampling plans that search for systematic effects are the most effective. Performing even very large numbers of measurements and then aggregating them into various statistical indicators masks systematic effects and does not allow optimization.
Look for systematic effects by collecting data in an appropriate way. It is not the quantity but the quality of data that matters. Analyze in a practical way. In the case of data collected from process observation, the box plot is often the only one needed.
