

You can find the first parts of the article here:
It’s time for the final conclusions, i.e. the DoE analysis
We’ll begin with the Y3: scale analysis, which is a visual assessment of the yolk set level on a scale of 1 to 16. The higher the score on the scale, the more set the yolk. In our case, values from 5 to 10 indicate a perfect yolk, below 5 indicates undercooked yolk, and above 10 indicates overcooked yolk.
The DoE analysis for Y3 will involve answering the following questions:
1. Which factors created the variation in Y3: scale? Which ones would we consider active?
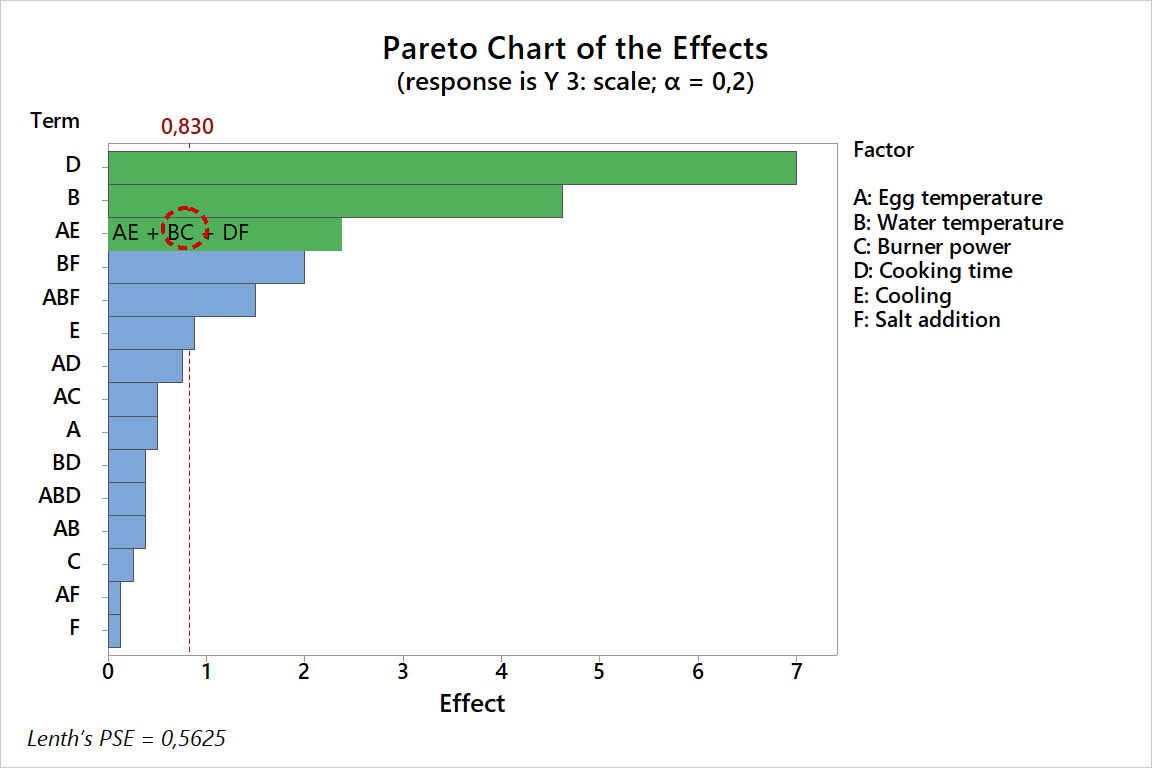
To answer this question, we use a Pareto chart, expert knowledge, and—in the case of fractional experiments, such as in this DoE—we must remember the alias structure.
Click to enlarge
The Pareto chart above shows statistically significant effects. However, it’s important to remember that statistics are only a guide. Which effects we consider to be creating variation in this DoE should be determined by their practical significance, i.e., the magnitude of the effects. The magnitude of the effect indicates the potential to influence the analyzed Y.
In our case, for example, the effect D is 7, meaning that changing factor D from the tested level of -1 to +1 shifts the position on a scale of 1 to 16 by 7 places.
In this DoE, due to the magnitude of the effects, two main effects are active:
- D: cooking time,
- B: water temperature.
The next largest effect is the chain of confounds AE + BC + EF. Considering the probability of these three interactions, the most probable interaction is B × C, i.e., B: water temperature × C: burner power. Although its effect is small, we will also consider it to precisely understand the impact of factor B.
| Factor | Effect |
|---|---|
| D: Cooking time | 7,000 |
| B: Water temp. | –4,625 |
| B: Water temp. × C: Burner power | 2,375 |
Model summary
R-sq: 89,92%
R-sq(adj): 86,25%
These three effects – D, B, and BC – explain almost 90% of the variation created in yolk cook quality.
2. How do the active effects affect yolk cook quality?
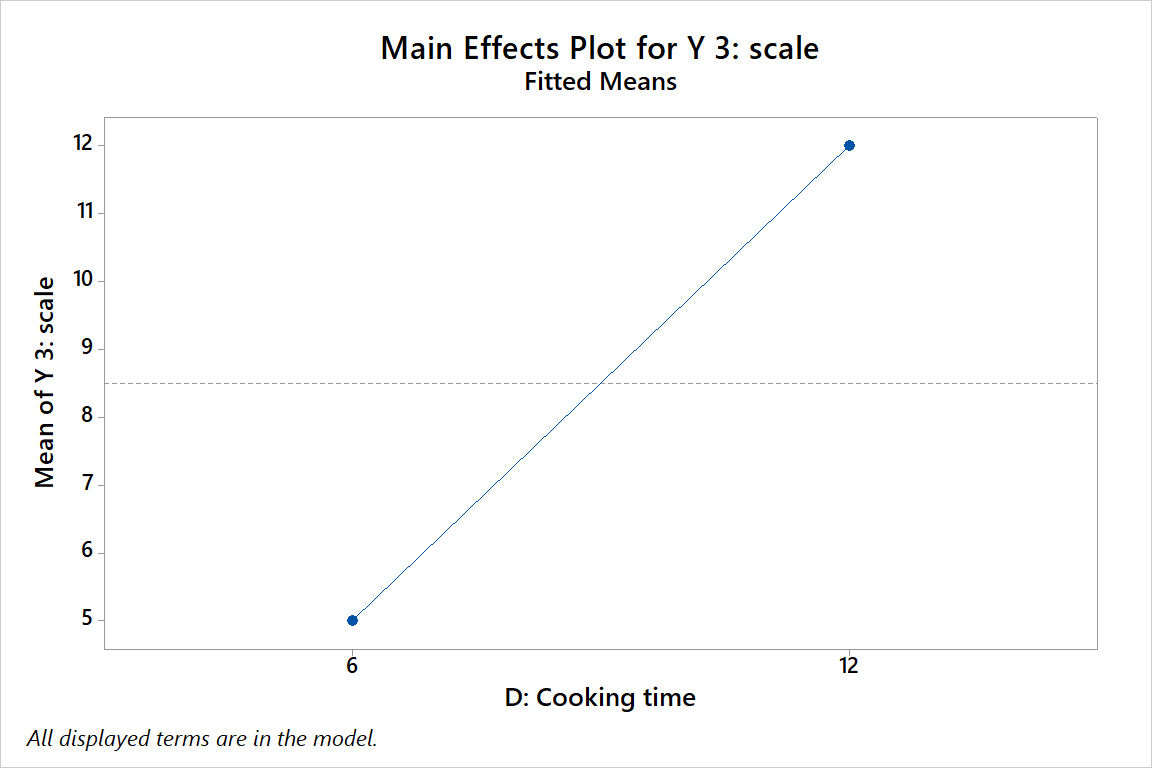
In this step, we use main effects and interaction plots.
Click to enlarge
Effect D: Increasing cooking time from 6 to 12 minutes changes the average visual yolk score from approximately 5 to approximately 12 on a 16-point scale. As a reminder, values from 5 to 10 indicate well-cooked eggs, below 5 indicate undercooked eggs, and above 10 indicate overcooked eggs.
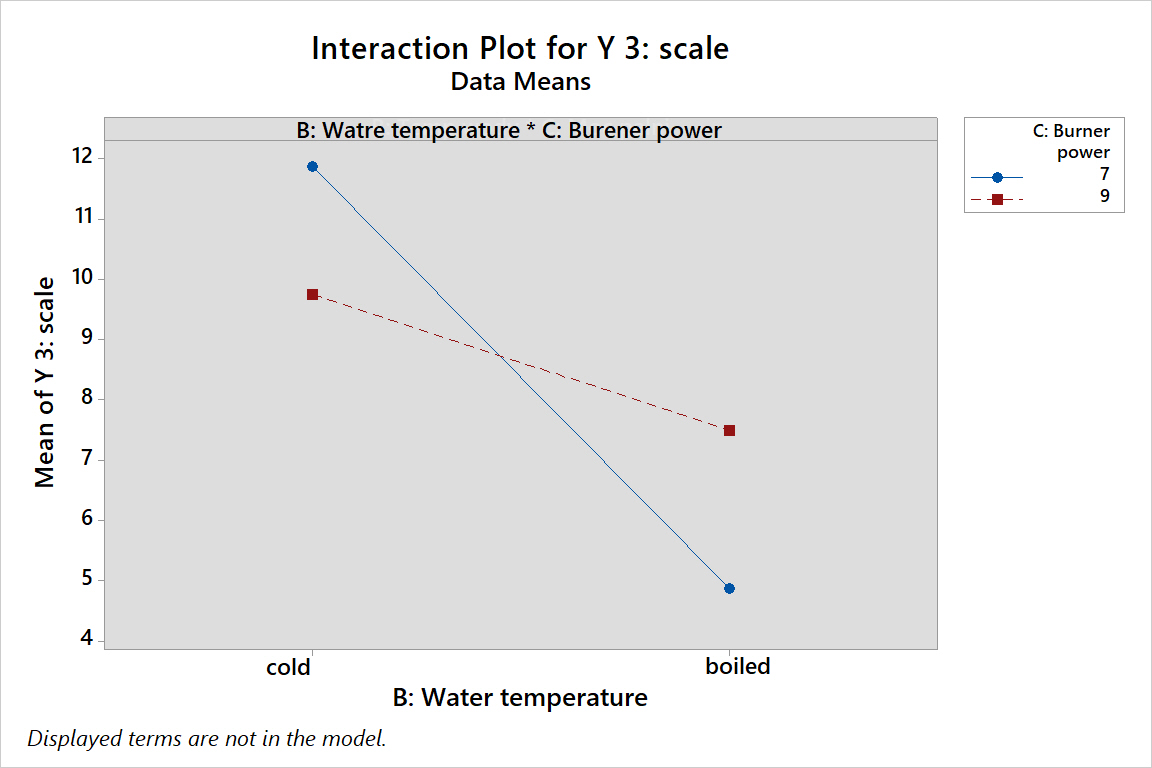
Because B: water temperature interacts with C: burner power, analyzing the main effect B alone is meaningless – its behavior depends on the setting of factor C. A final interpretation of effect B is possible only after analyzing this interaction.
Click to enlarge
Contrary to our expectations, the temperature of the water in which we place the egg affects its degree of set. This is because an egg placed in cold water remains under the influence of temperature for a longer period (cooking time was always measured from the moment of boiling).
This effect is amplified by the power of the burner. Lower power (7) further extends this time, resulting in a drier yolk – an average of 12 on a scale of 1 to 16.
At a higher power (9), the effect of the water temperature at the start is smaller, as the time to reach a boil is shorter, and the eggs – regardless of the water temperature – are properly set: an average of 10 for cold water and about 8 for boiling water (on our scale, properly set eggs received ratings of 5 to 10).
3. Let’s summarize what we’ve learned about achieving the perfect yolk.
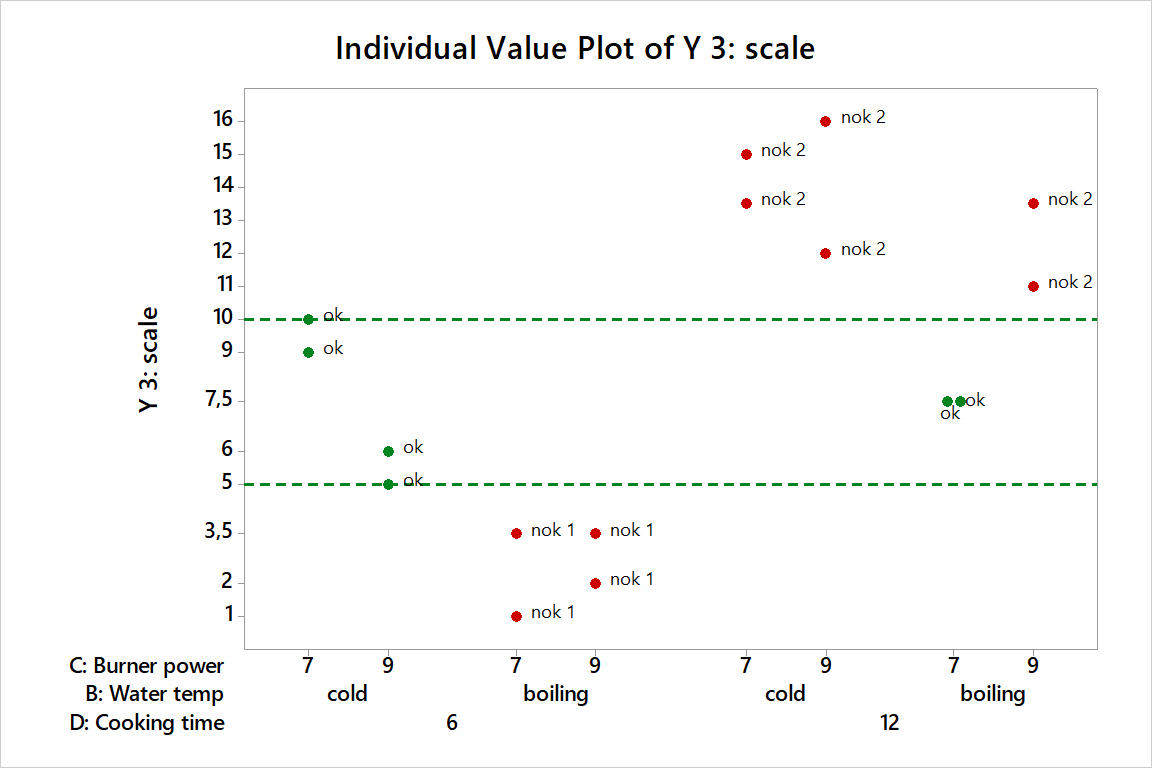
The Individual Value Plot is the perfect tool here.
Click to enlarge
Eggs marked as ok have perfectly set yolks with a creamy consistency, without any signs of dryness or green rings. Nok 1 eggs are undercooked, while nok 2 eggs have dry yolks.
To achieve perfect yolks, we have several options. The first is to boil the eggs for 6 minutes and place them in cold water – the heat setting being irrelevant (of course, within the tested range of 7 vs. 9).
Perfect yolks can also be achieved by boiling the eggs for 12 minutes, but then they must be placed in boiling water and the heat setting should be set to 7.
The remaining factors tested in this DoE, as long as they remain within the tested levels, have no impact on the degree of yolk set. They may be relevant to the second Y we want to analyze, Y4: egg peeling time. Let’s conduct a similar analysis.
4. Which factors created variation in Y4: peeling time? Which ones would we consider active?
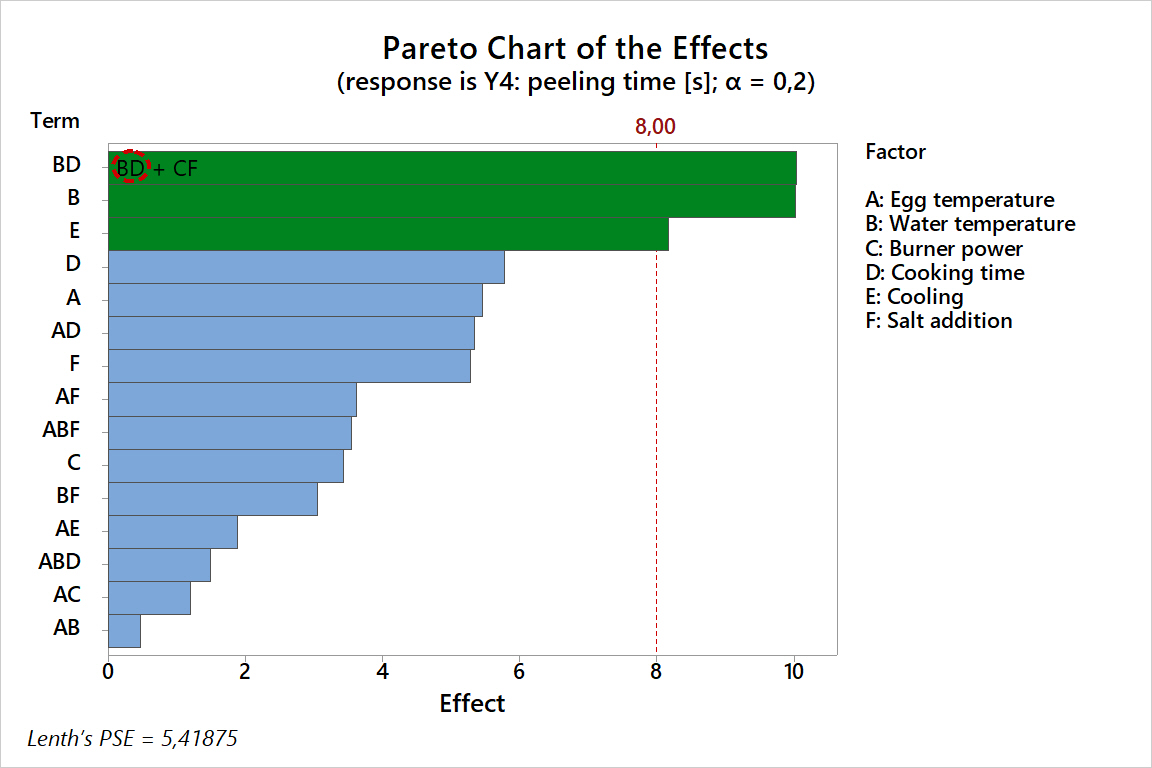
Click to enlarge
In the case of peeling time, we consider effects greater than 8 seconds to be active. Smaller effects – due to the measurement system (stopwatch measurement) – are negligible from a practical perspective.
The active effects are:
- interaction B: water temperature × D: cooking time,
- main effect E: cooling.
The Pareto chart also indicates the main effect B, but its interpretation is only possible after analyzing the interaction BD, so a graph of the main effect B is not necessary here.
5. How do active effects affect peeling time?
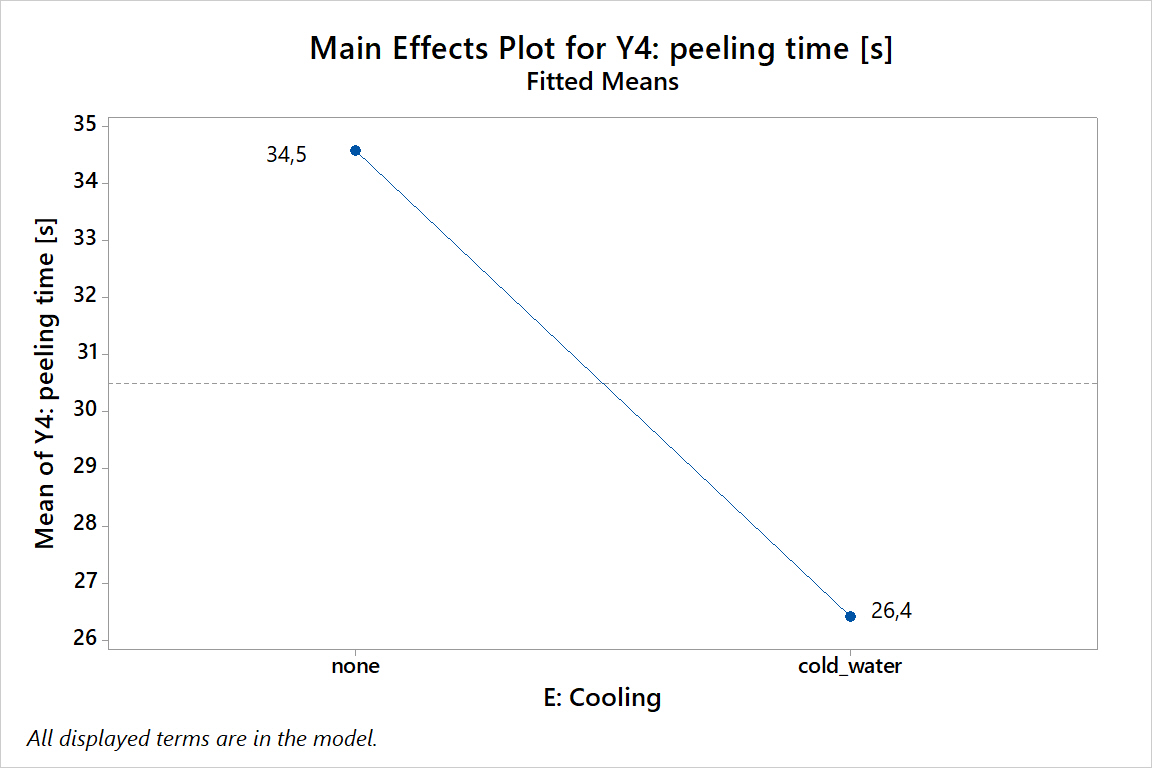
Click to enlarge
Effect E: Refrigerating eggs after cooking reduces the average peeling time by about 10 seconds.
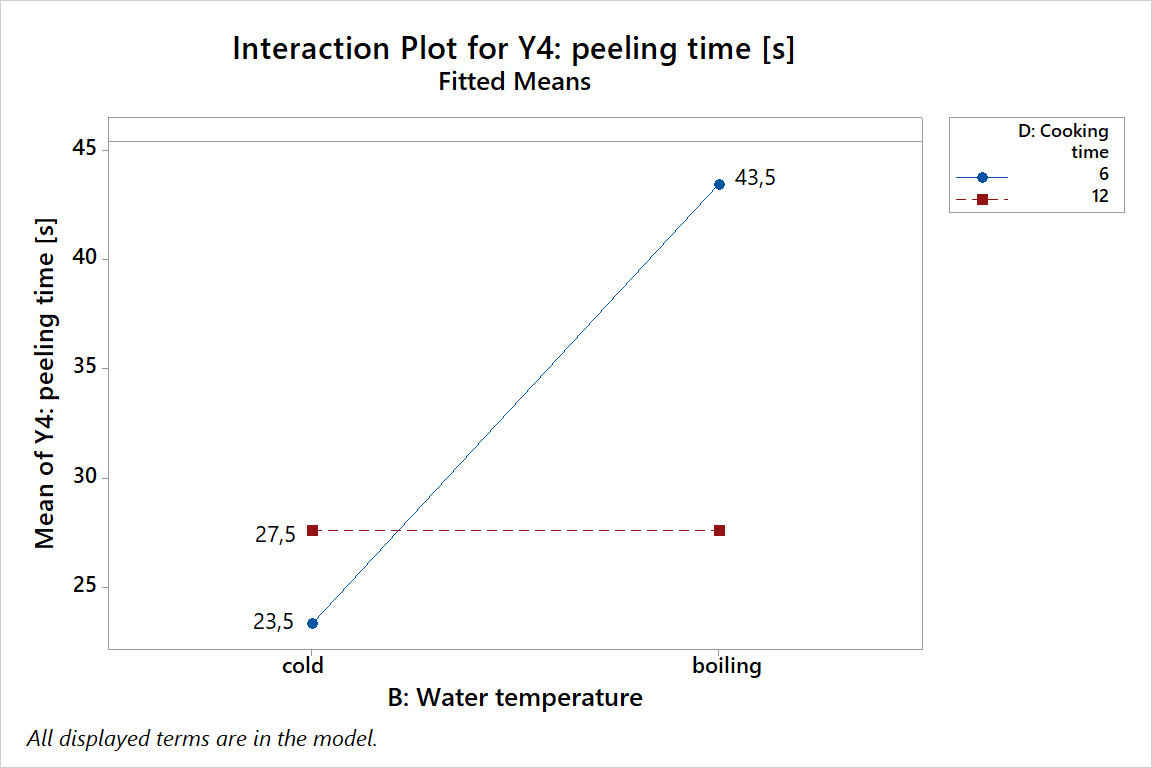
Click to enlarge
When the cooking time is 12 minutes, the starting water temperature is irrelevant, and the average peeling time is approximately 27.5 seconds.
When boiling eggs for 6 minutes, placing them in boiling water increases the peeling time from an average of 23.5 seconds to 43.5 seconds. This is because the most difficult—and therefore longest—to peel were the undercooked eggs (nok 1, or <5 on the scale), boiled briefly and then placed in boiling water. These eggs were so soft that their consistency made peeling difficult.
6. Let’s summarize what we’ve learned about how to obtain the perfect yolk and egg that peels quickly and easily.
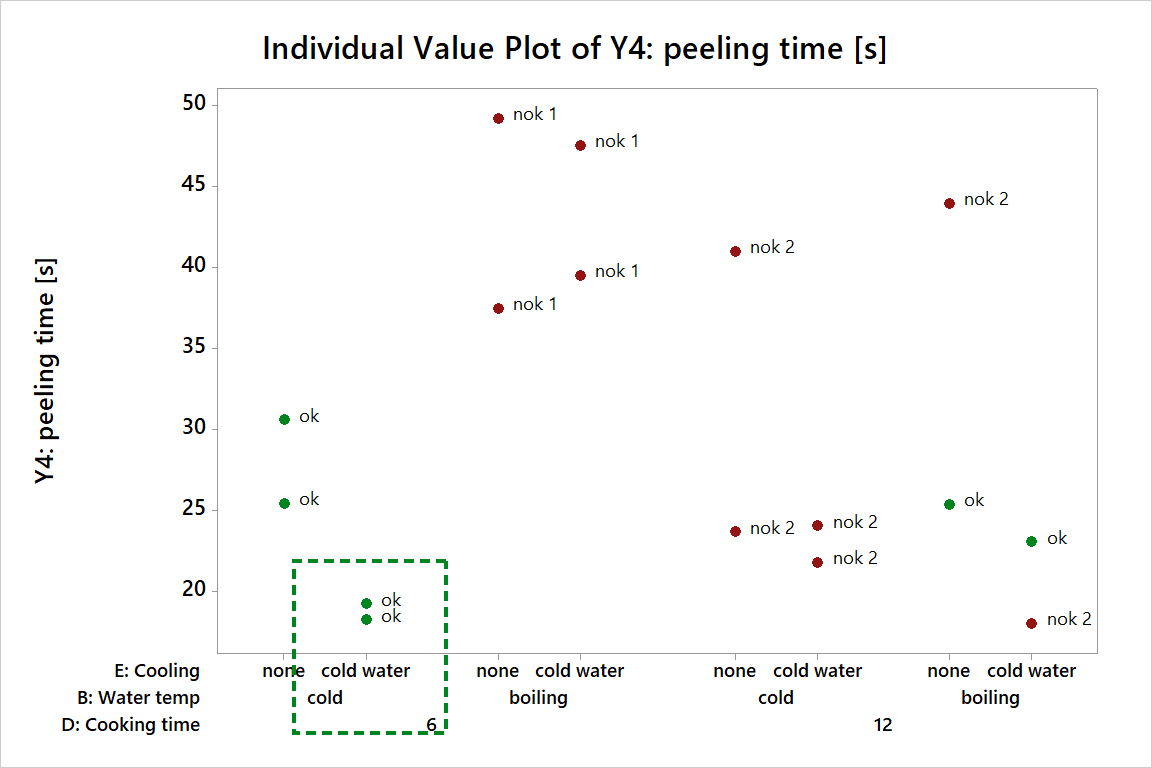
Click to enlarge
A short peeling time can be achieved in many ways. However, a short time doesn’t always mean a good yolk – overboiled eggs (no. 2) also peel easily. Therefore, in the final analysis, the conclusions from all the Y-s should be combined.
Perfect yolks and eggs that peel in about 20 seconds can be achieved by placing the eggs in cold water and boiling them for 6 minutes, then cooling them. The burner power (7 vs. 9) doesn’t matter at this setting, as we know from the Y3 summary: scale.
The other factors tested in this experiment also have no impact on either yolk quality or peeling time and can be set freely – within the tested levels, of course.
And that’s the end of the egg story. My main goal was to show the planning stage, but out of curiosity, we also conducted the experiment and analysis, and in the end, we created a delicious egg spread 🙂
