

You can find the first parts of the article here:
How to analyze an experiment? Let’s start practically!
1. Did we create variation?
We now face a practical analysis, i.e., a diagnostic to determine whether everything went “OK” during the DoE. The fundamental question we should ask ourselves here is: Did we create variation in the measured Y values? A positive answer to this question determines the validity of further analysis. If we did not create variation, it means we tested the wrong factors or levels, and we should return to DoE planning.
As a reminder, in our DoE, we will assess:
Y1 – Goldenness of the yolk [Reed/Green], RGB measurement
Y2 – Green ring, Green channel value
Y3 – Visual yolk quality, ranking the yolks from least to most set
Y4 – Peeling time [s]
Y5 – Shell weight [g]
Y6 – Weight loss after cooking [%], the ratio of the egg weight before and after cooking.
This is described in detail in Part II
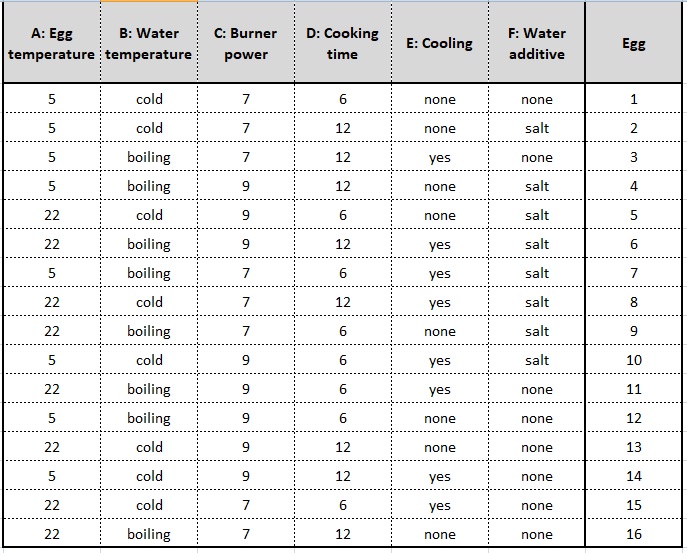
We conducted the experiment completely randomly, according to a previously created matrix of 26-2IV=16. We boiled 16 eggs in this way. The egg number also indicates the order in which the eggs were boiled and measured.
Click to enlarge
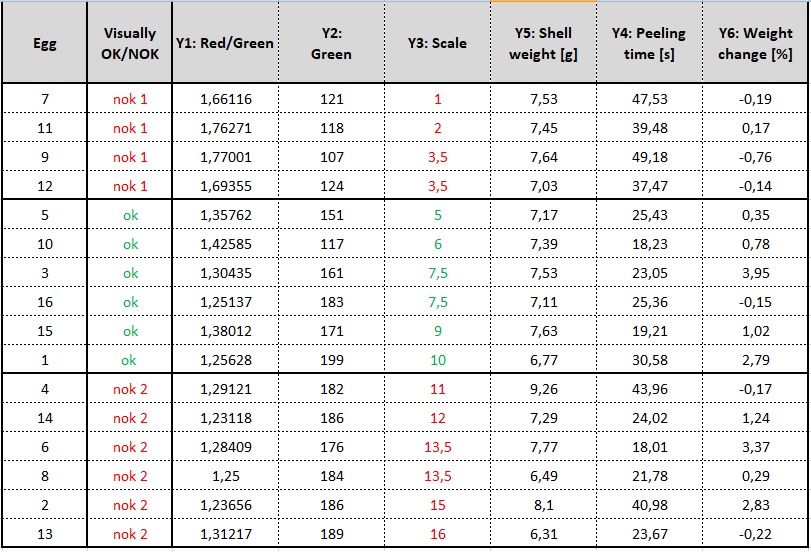
All eggs were weighed both before and after cooking. We thus designated Y6: mass loss after cooking, for each run. We observed no significant variation in this Y. This is most likely due to the fact that all eggs were the same size, and contrary to our expectations, none of them cracked during cooking (no protein loss). This means that the factors tested in this DoE do not affect this Y, and therefore, it is not worth analyzing.
The eggs were then peeled. We measured Y4: peeling time, and weighed Y5: shell mass. Regarding Y5, we also observed no variation worth analyzing. This is due to the fact that, contrary to our expectations, there were no eggs with some protein remaining attached to the shell during peeling—as indicated by shell mass. This means that the tested factors do not affect this Y.
Y4: Peeling time, depending on the egg, ranged from 19 to almost 50 seconds – this is a large variation, meaning that the tested factors affect the egg peeling time. Therefore, Y4 will be analyzed as the response from this DoE.
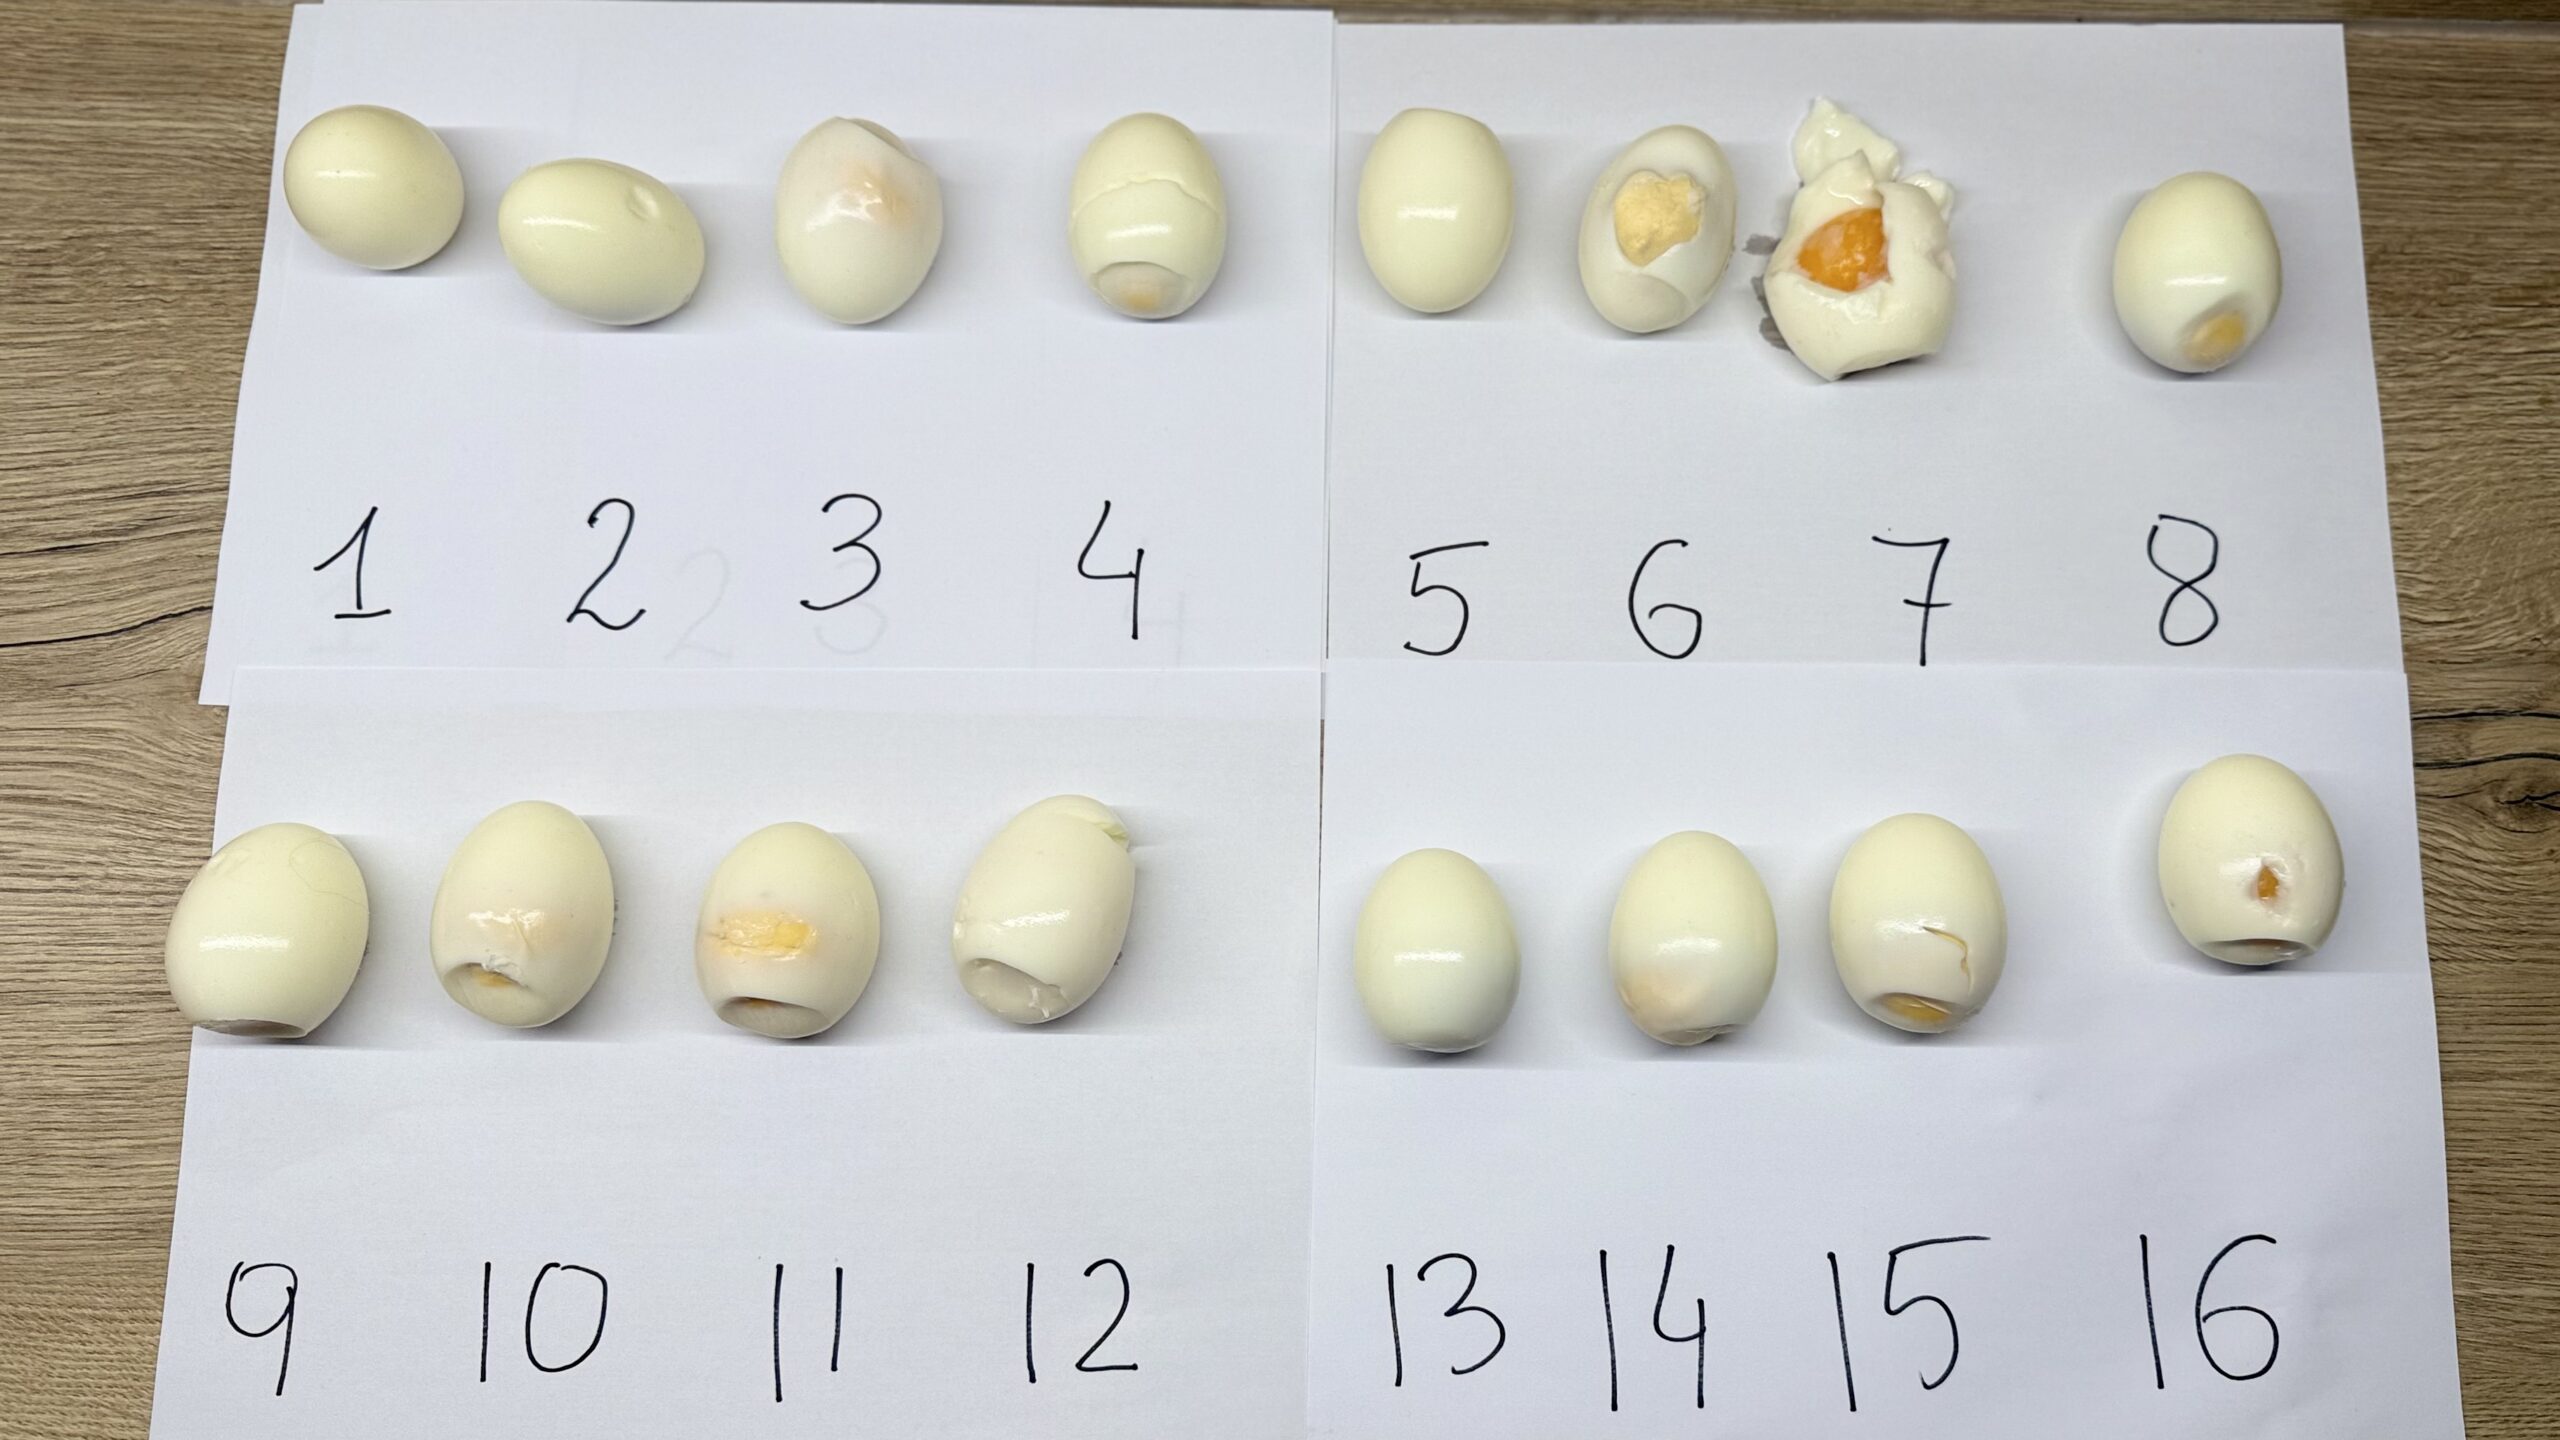
The photo above shows eggs after peeling, from subsequent runs of the experiment.
The eggs vary in hardness, from undercooked eggs like No. 7, to eggs that appear to be properly set, to eggs that are very hard, like No. 2 or No. 13 (it’s difficult to capture in a photo, so you’ll have to take our word for it). The final assessment of the variation in hardness created will be made after cutting them open and assessing the yolk quality.
The eggs were cut open and arranged from the least hardened (undercooked not only the yolks but even the whites) through perfectly creamy yolks, to clearly overcooked eggs with a green rim. We then assigned them consecutive numbers, creating a scale called Y3. Since there were 16 eggs, we wanted to number them from 1 to 16. For eggs that were identical, such as No. 9 and No. 12, which would be ranked 3 and 4 on the scale, we used the average of the two, i.e., 3.5, to rate both. We used the same procedure for eggs 6 and 8.
Additionally, we visually assessed the quality of the yolks, and the Y3 scale indicates:
- 1 to 3.5 are undercooked eggs (marked as No. 1)
- 5 to 10 are well-cooked eggs (marked as OK)
- 11 to 16 are overcooked eggs (marked as No. 2)
The photo below shows the eggs after cutting, the Y3 scale, and the visual assessment.
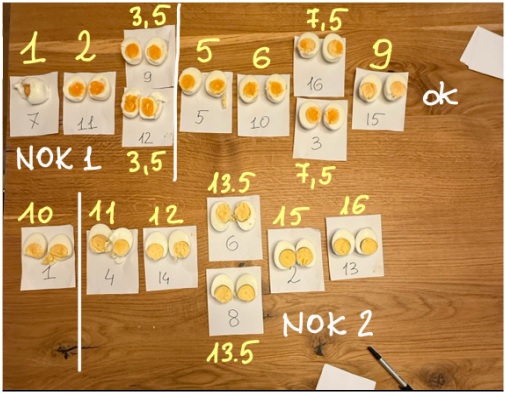
As seen in the photo above, we created variation in yolk consistency, which means that the tested factors and their interactions influence egg cooking quality. Therefore, Y3 will be analyzed as a response from the DoE.
To compare the scale with continuous measurement, yolks from subsequent eggs were also measured on the RGB scale using a special application. Based on this, Y1: Red/Green and Y2: Green will be determined, which, like the Y3: scale, will be a measure of yolk cooking quality.
In summary, we will analyze Y1, Y2, and Y3 (describing yolk quality) and Y4 (peeling time). We did not create variation in the remaining Ys, so their analysis is not meaningful.
The results for each run are presented in the table below.
Click to enlarge
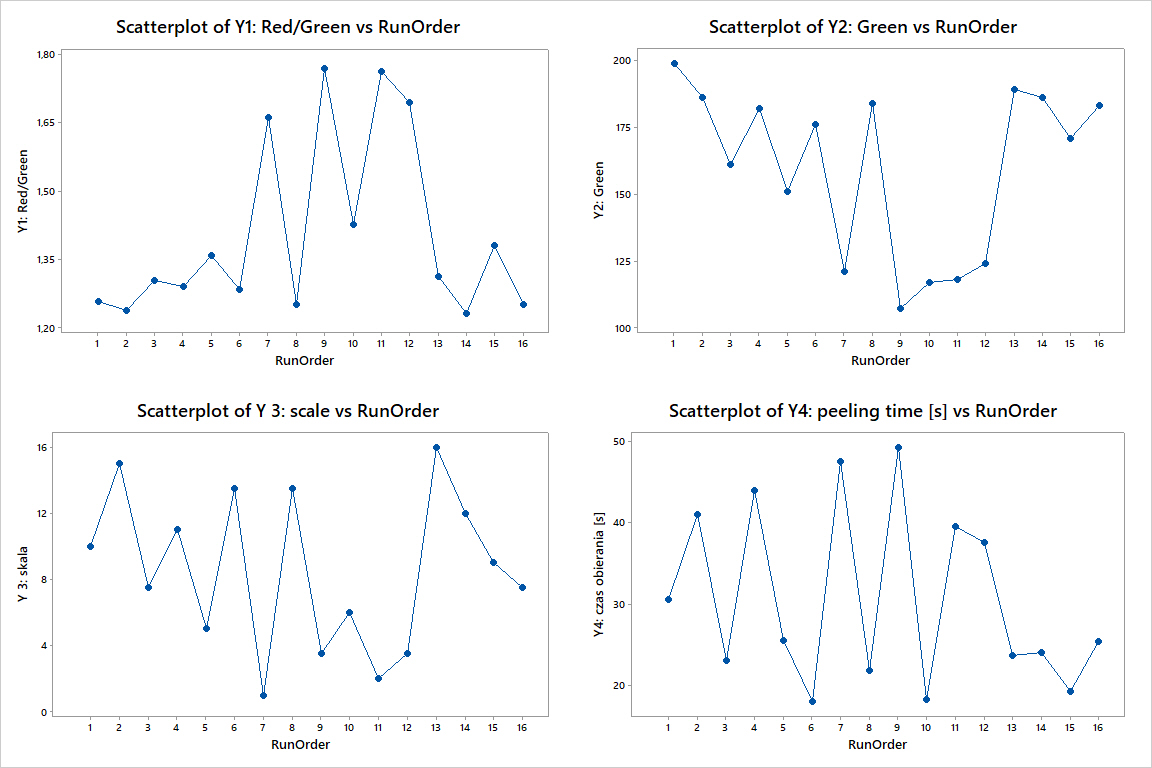
2. Was the variation created by the tested factors and their interactions, or perhaps by something that changed during the doe run?
The next question is whether the doe run results are independent of the timing of the experiment. Was the variation we’re enjoying in point 1 created by the tested factors and their interactions, and not by “something” that changed during the experiment? To do this, we need to plot the Ys, which we intend to analyze according to the order of the runs. In our case, the egg number is also the order, so we’ll plot the results for subsequent eggs.
In this graph, we want to see the lack of dependence of the doe run results on the timing of the run. Any dependence of the Ys on the order of the doe runs should give us pause. While we can’t explain this lack of randomness by a lack of randomness in the experiment, it means that the variation in the doe run was created by “something” that changed during the experiment. In the case of boiling eggs, it’s hard to imagine what that could be. Classic real-life examples include tool wear, rising ambient temperature or humidity, tool changes, and so on. If this is the case, subsequent DOE analysis, which involves assigning responsibility for variation to individual main effects and interactions, is meaningless – for the simple reason that they did not create it.
In our case, there is no dependence of the Y values on time, as the graphs below demonstrate.
Click to enlarge
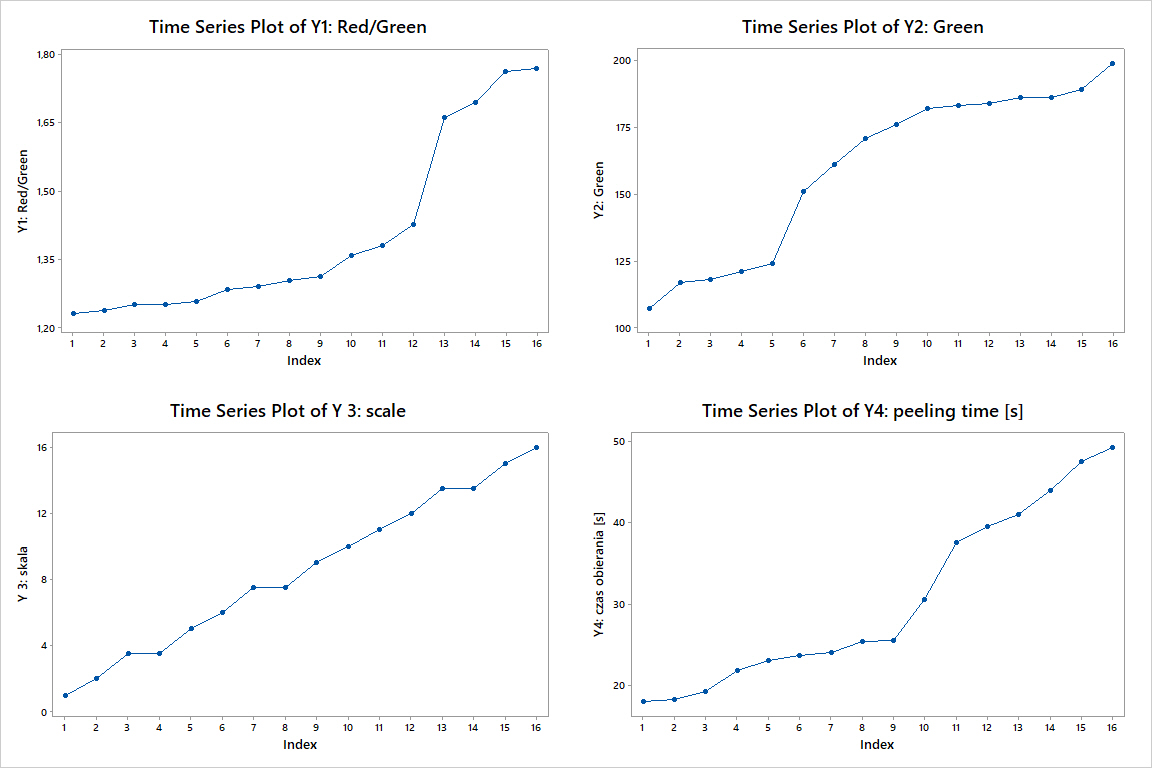
3. Do you suspect potential special causes?
The final step in the practical analysis is to plot each Y-value we want to analyze from minimum to maximum. A uniform increase means that such a special cause most likely did not occur. A point significantly deviating from the rest, either positively or negatively, potentially indicates cumulative effects (everything good/bad for a given Y-value occurred in this run), or if this did not occur, evidence of a special cause.
The occurrence of a special cause means that during one of the DOE runs, an event occurred, completely outside the scope of the experiment, that significantly changed the results of that run. Diagnosing such an event is important for two reasons. First, it changes the conclusions we draw from the experiment; it can create nonexistent effects or obscure significant ones. It would also be appropriate to “fix” the data or repeat the run. Second, remember that a special cause is an interesting event, especially if it produces the desired effects in the Y-value; it can yield more knowledge than more than one DOE. Of course, special variation is a rare event, so it won’t occur in most experiments you’ll run, but we encourage you to never skip this step of the analysis. In the case of our Ys, we don’t observe
Click to enlarge
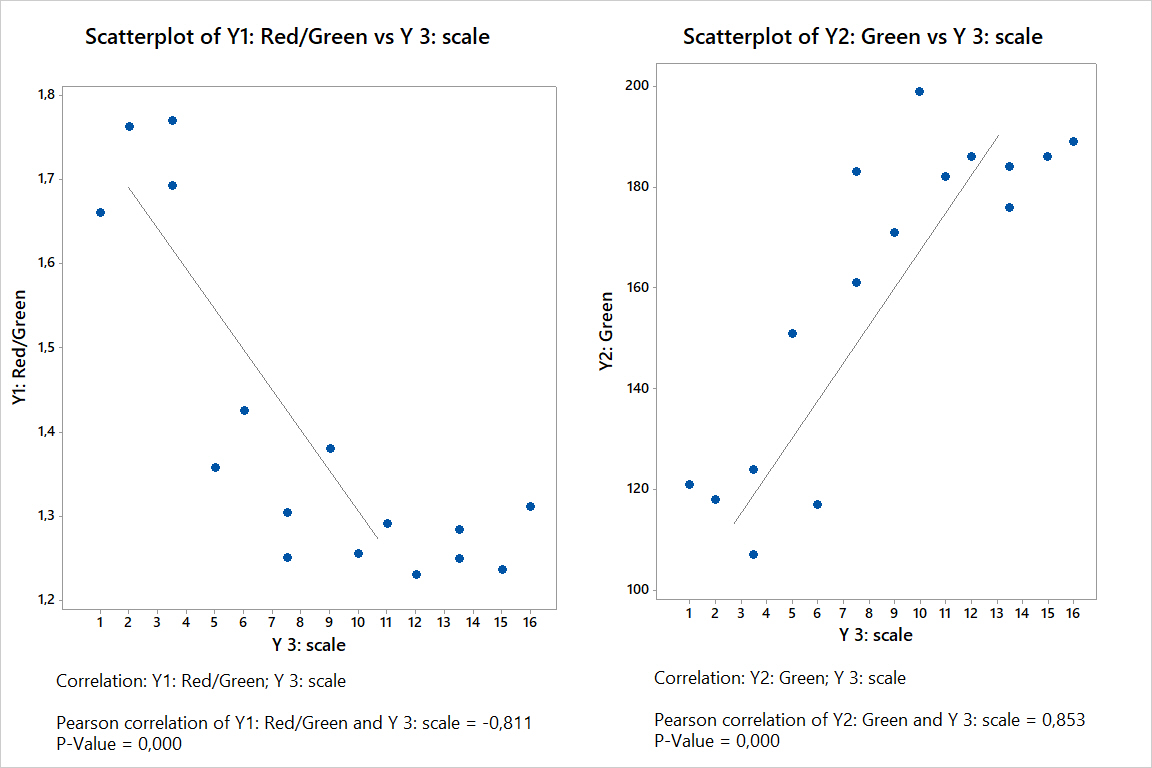
4. Additionally, can we check whether the Y we measured in DoE are correlated?
In our case, the three Ykis describe the yolk color in different ways. While the correlation between Y1: Red/Green and Y2: Green is obvious, it’s interesting to see if these Ykis are correlated with the scale we created by visually comparing the yolks. The graph below shows that this is the case.
Y1: Red/Green is negatively correlated with the Y3: scale, meaning that the same factors will affect both Ykis in opposite ways. The higher the Y1, the lower the position on the scale (the yolk is more orange). Y2: Green, on the other hand, is positively correlated with the Y3: scale. The more the green channel, the drier the yolk—the higher the position on the scale. This means that the same factors will affect both Ykis in the same way.
Therefore, the final analysis will be performed for Y: 3 scale (analysis of Y1 and Y2 will give the same conclusions) and for Y4: peeling time.
Click to enlarge
And that’s the end of the practical analysis. After ensuring that we’ve created variation greater than what we observe on a daily basis. We’ve created good and bad eggs, undercooked and overcooked, and good eggs. We’ve ensured that this variation wasn’t caused by factors changing during the DOE or by special causes, it’s time for the actual numerical analysis, which we’ll perform according to the procedure explained in the article.
Full Factorial Design, Design of Experiments, DOE – Design and Effect Estimation
