
You can find the first parts of the article here:
Creating a Prediction Table – Summary of the Planning Stage
To summarize the planning phase, it is useful to create a Prediction Table that documents our knowledge prior to the DoE. This is a good way to begin a report on what we learned from the experiment. It is also very helpful during the analysis phase—especially in fractional designs—provided that it includes not only the predicted effects of the tested factors but also the potential second-order interactions.
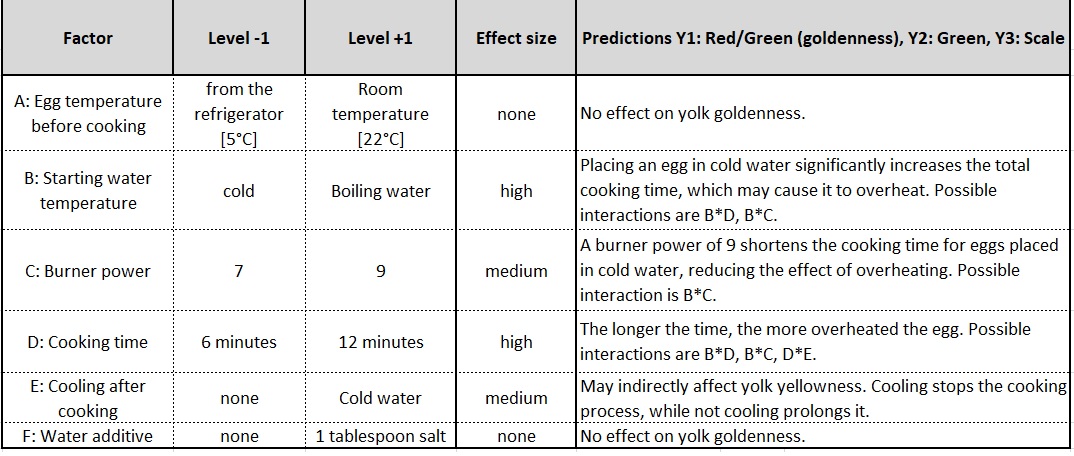
Y1: Red/Green, Y2: Green, and Y3: the Visual Scale (eggs arranged from least set, through properly cooked, to overcooked) describe yolk yellowness in three different ways. We expect these responses to be correlated, meaning the same factors and interactions will drive variation in each of them.
Y2 and Y3 will be positively correlated: the higher the score on the visual yolk scale (the more set/overcooked the yolk), the higher the fraction of green in the RGB measurement.
Y1 and Y2 will be negatively correlated, as will Y1 and Y3. The more golden the yolk, the lower the green fraction and the lower the position on the scale. The predictions for these three responses are shown in the table below.
Click to enlarge
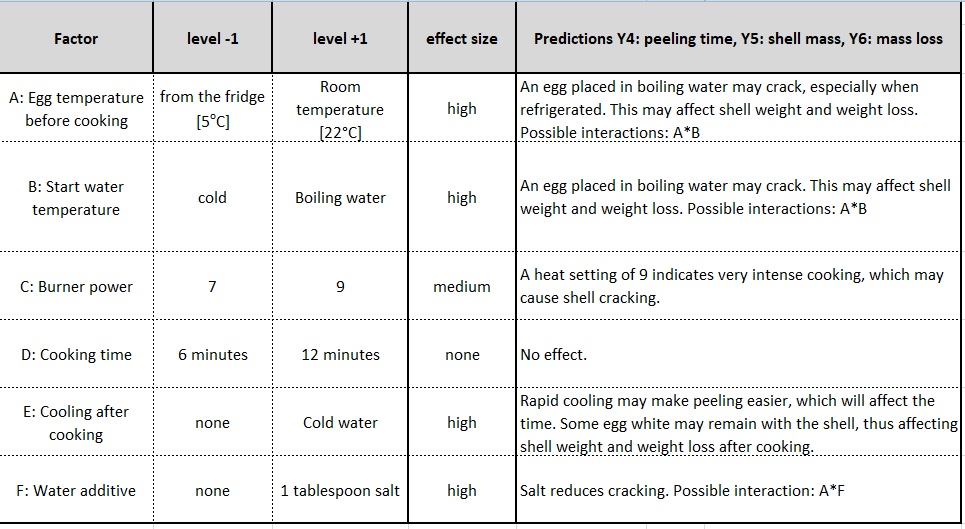
For Y4: peeling time, Y5: shell mass, and Y6: mass loss after cooking, we predict that if peeling time is short, it means the shell separates cleanly from the egg white, resulting in minimal mass loss. The more cracking occurs, the more egg white leaks out and the greater the loss of mass. We also assume that such eggs will be more difficult (i.e., take longer) to peel, and part of the egg white will remain attached to the shell. Predictions for these three responses are shown in the table below.
Click to enlarge
How to Conduct the Experiment
The experiment planning is complete. Now it is time to execute it according to the plan.
We conduct the experimental runs according to the design matrix created in Part 2. Whenever possible, we should maintain full randomization. However, I would be lying if I said this is always feasible. Very often—especially in industrial settings—we choose an order that minimizes the time or cost of running the experiment. Factors that are difficult or costly to change are adjusted less frequently, which limits randomization. It is important to remember this during the analysis stage, as it introduces additional constraints on inference.
Regardless of whether we can randomize fully or not, it is essential to record the actual run order.
When performing a DoE and setting up each run according to the matrix, we can make one of two mistakes:
Incorrect settings, e.g., using an egg at room temperature instead of a refrigerated egg as planned. The only remedy is to carefully check each setting before executing the run.
Assuming a factor has reached its intended level when it has not. For example, we take eggs out of the refrigerator 10 minutes before the experiment and treat them as room-temperature eggs, even though they won’t reach that temperature for another hour. All factors with inertia must be handled with extra care. We can check in advance how long it takes to reach the desired level, or verify the settings during the DoE.
If either of these errors occurs, the design matrix loses balance and orthogonality, and with that we lose the ability to independently estimate effects for all degrees of freedom. (More on this topic HERE.)
Of course, we must clearly label which egg comes from which run. While this is easy before peeling, it is essential to maintain correct labeling while weighing shells and evaluating the eggs after peeling. If anything gets mixed up at this stage, the analysis will inevitably produce incorrect conclusions.
The last thing to keep in mind is that if anything happens during a run that might potentially affect its results, we should record it. If the event completely compromises the measured response and we can repeat the run, we should do so. If repeating is not possible, we can address the issue during the analysis stage, but ideally we want complete and reliable data from the entire DoE.
Now keep your fingers crossed that we generate sufficient variation – from undercooked eggs with runny yolks, through perfectly cooked ones, to overcooked eggs with a green ring around the yolk. If the factors and levels we selected allow for this, the next part will focus on analyzing the results of this DoE.