

You can find the first part here:
Defining statistically significant effects
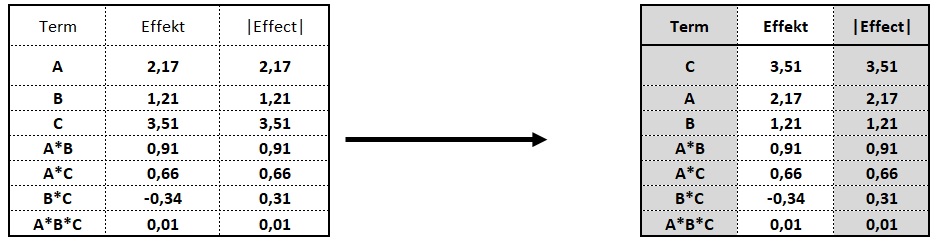
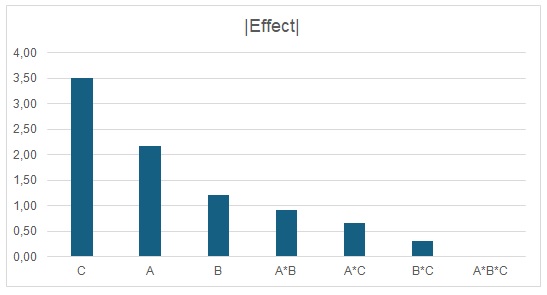
To determine statistically significant effects, you need to draw a Pareto chart, i.e. plot the absolute values of the effects in descending order.
Next, we calculate the level of the line that indicates statistically significant effects (professionally called ME, for Margin of Error). There are several ways to find it; we’ll use the classic Lenth method, following the steps shown in the table below.
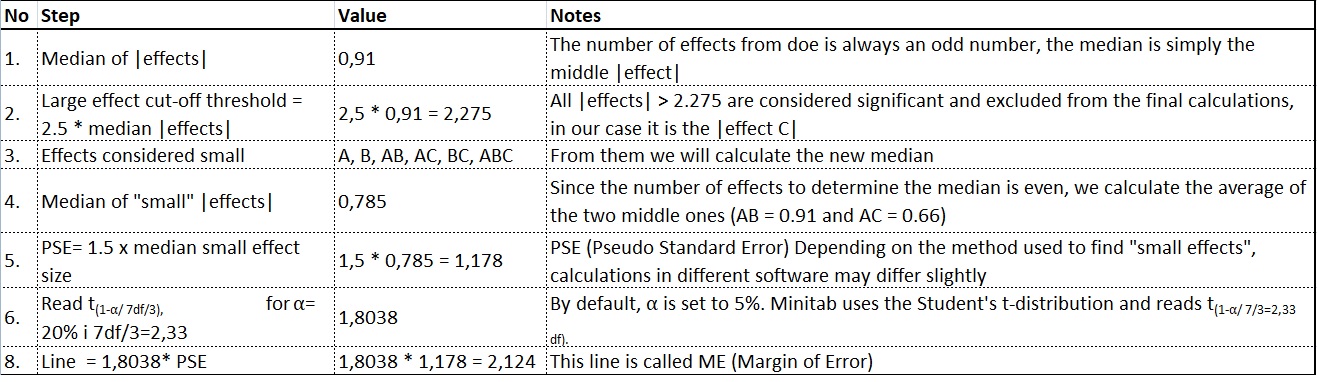
Click to enlarge
We put the line on the Pareto chart and it ultimately looks like this:
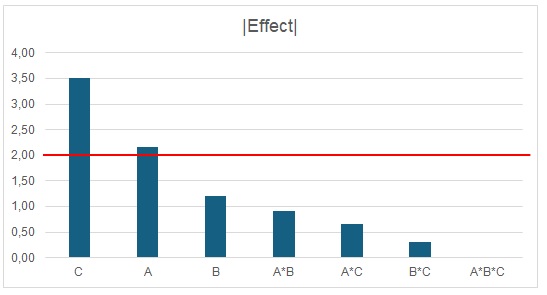
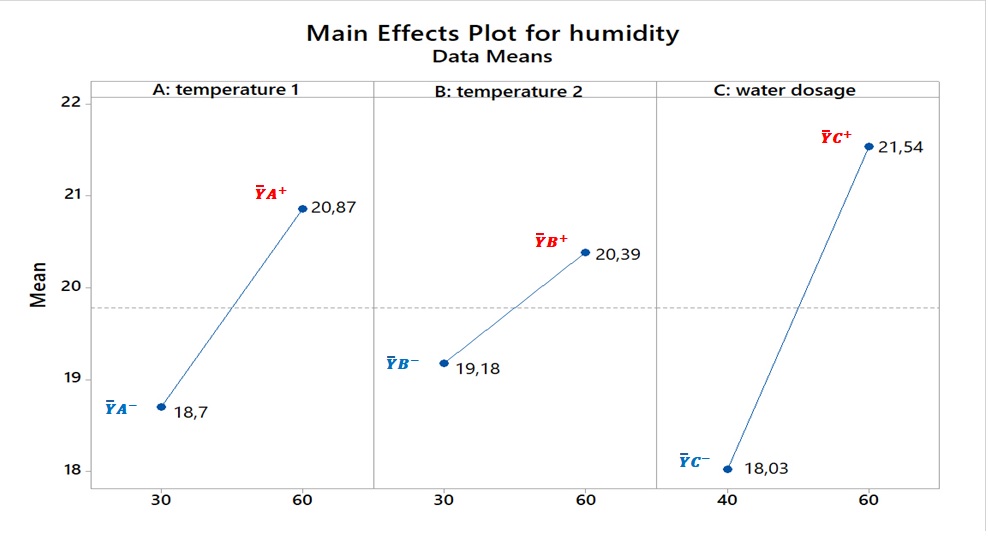
The line separates statistically significant effects from those we should consider to be a noise. Crucially, statistical significance isn’t everything. Statistics are just a suggestion. What we should base our decision on is the effect. Effect size indicates the potential for influencing y, or powder humidity. In this case, effects greater than 1% are important from a practical perspective. Therefore, for further considerations, we will add effect B to the statistically significant main effects C and A. Their final interpretation involves drawing graphs of the main effects. The Main Effect graph is created by connecting the means of y calculated for both levels of a given factor with a line.
Click to enlarge
Effect A:
Changing temperature 1 from 30°C to 60°C causes an increase in the mean powder humidity by 2.17%, from a mean humidity of 18.7% to a mean humidity of 20.87%.
Effect B:
Changing temperature 2 from 30°C to 60°C causes an increase in the mean powder humidity by 1.21%, from a mean humidity of 19.18% to a mean humidity of 20.39%.
Effect C:
Changing the water dose from 40% to 60% causes an increase in the mean powder humidity by 3.51%, from a mean humidity of 18.03% to a mean humidity of 21.54%.
Now we can summarize what we’ve learned in this lesson. A fantastic graph is the Box Plot, which simply demonstrates the effects we’ve learned and is easy for everyone to understand.

Click to enlarge
The enamel powder humidity variation generated in this doe ranged from 17% to 24%. Three factors were tested in this doe, each of which proved significant. No interactions between these factors proved significant and were therefore not considered.
The largest effect is effect C: water dose (red arrow). Changing the water dose from 40% to 60% increases the average powder humidity by 3.51%. Changing A: temperature 1 from 30°C to 60°C (green arrow) increases the average powder humidity by 2.17%. The last smallest effect is effect B. Changing B: temperature 2 from 30°C to 60°C (blue arrow) increases the average powder humidity by 1.21%.
Looking at the graph above, you can also see that effect B: temperature 2 is different depending on whether temperature 1 is set to 30°C or 60°C. When temperature 1 is set to 30°C, temperature 2 has no significant effect on the powder humidity. However, when temperature 1 is set to 60°C, changing temperature 2 has a significant effect on the average humidity.
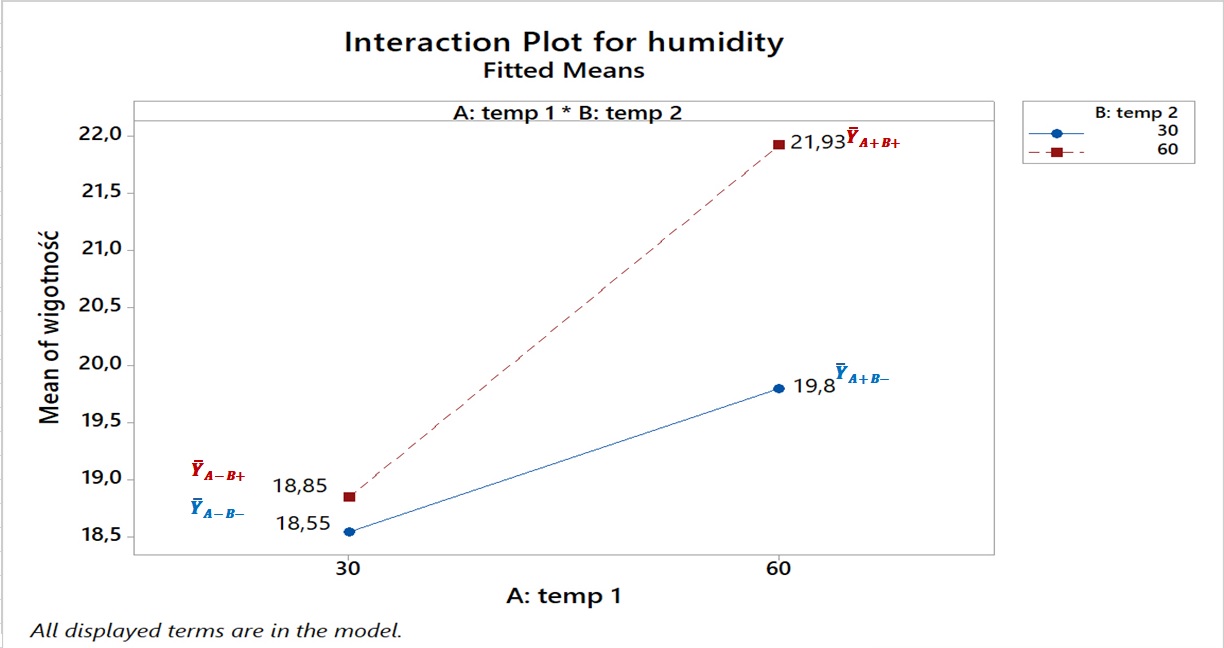
This is a classic interaction, which, however, turned out to be statistically and practically insignificant (yes, yes… you have to be careful with this statistic). To better understand the effect of changing factor B for different levels of factor A, let’s draw the effect of the AB interaction.
Click to enlarge
When the B: heater 2 temperature is 30°C (blue line), then changing the A: heater 1 temperature from 30 to 60°C causes an increase in the average powder humidity from 18.55 to 19.8%, i.e., by 1.25% on average. However, when the B: heater 2 temperature is 60°C (red line), then changing the A: heater 1 temperature from 30 to 60°C causes an increase in the average powder humidity from 18.85 to 21.93%, i.e., by 3.08% on average, which is a very large effect from a practical point of view, similar in magnitude to the effect of A: water dose.
Summary
The goal of the DOE was to understand how to control the dryer to obtain powder with the desired output humidity. The box plot above could be said to demonstrate how to adjust the machine to achieve the required humidity content – naturally, within a range of 17 to 24%. Going beyond this range would require further experimentation. With well-defined levels, it’s safe to assume interpolation will work; extrapolation is absolutely impossible to be certain of.
While we personally believe the box plot above is sufficient for determining dryer settings to deliver powder humidity within the 17-24% range, depending on needs, we can construct a mathematical model, an equation, that will allow us to predict powder humidity content depending on the settings of the factors tested in this DOE. But more on that next time.
In the link below you will find the next, third, part of this article.
