
Process capability indexes(Cp, Cpk, Pp, Ppk)
Nowadays, customer-supplier relationships are increasingly based on long-term collaboration and the exchange of information. Discussions about specifications and their limits are often a key element of every emerging project.
The customer sets specifications and desires to receive products that meet agreed-upon requirements. On the other hand, the supplier needs to design and implement their process to produce to specifications. If such an arrangement were possible, everyone would be satisfied, and the only meetings would likely be about payment deadlines. In reality, this is not the case, and problems with defects, components, and products that don’t meet specifications are commonplace.
As a result, to meet requirements, supplier processes are largely based on 100% inspection, rework of already manufactured components, and subsequent sorting. Since we live in an era when all companies are implementing the Lean1 philosophy with varying degrees of success, all of these activities are wasteful. Therefore, it is crucial to produce parts with minimal variability.
Due to this approach, many organizations, instead of conveying customer requirements to suppliers solely in the form of specifications, want to know whether processes can meet their requirements without the need for 100% inspection and additional sorting. Therefore, they implemented the requirement to present process capability indicators for key product characteristics. These indicators were intended to both contain information about the specifications and also address the process’s performance relative to those specifications. A brilliant and clever idea, elegantly and fashionably named process capability indicators Cp, Cpk, Pp, and Ppk. This wouldn’t be a problem if both parties were aware of and understood the limitations of such indicators. Unfortunately, in most cases, organizations replicate patterns that perfectly fit the formula of a game of process capability indicators played by both suppliers and their customers, and this game usually takes the following form [2]:
- Before the first deliveries of a given component occur, customers want to know whether the supplier is capable of delivering 100% compliant products without the need for 100% inspection and sorting.
- The sales manager assures the customer’s purchasing department that their organization’s manufacturing process has the necessary capability to meet the customer’s requirements.
- The customer “fully consciously” requests proof that the supplier’s process actually possesses this capability. This typically ends with a request for one of the process capability metrics (Cp, Cpk, Pp, or Ppk).
- This, in turn, creates significant opportunities for the supplier to manipulate the data until the data looks sufficiently accurate.
Of course, this process may deviate from the general outline presented above in some cases, but as experience from various industries shows, this process is 99% consistent. Consequently, engineers and managers often hear that all suppliers provide calculated process capability metrics; these numbers usually look very good, but the component quality remains at the same low and unacceptable level. Looking at this situation honestly, it’s worth realizing that any supplier under pressure quickly acquires the ability to manipulate data to make it look better. This approach usually yields short-term results, such as calming the customer’s mood. In the long term, however, it can only lead to negative consequences, such as customer loss, as senior management will no longer care about process capability metrics, believing (correctly, of course) that there are more important business factors and supplier evaluation processes.
So why does everyone calculate metrics when the result is as described above? First, because they are unaware of and do not understand the limitations of these metrics; second, because they follow templates due to a lack of critical thinking; third, because everyone does it; and fourth, because they are very easy to calculate along with the percentage of non-conforming parts. These are the main reasons why most organizations use process capability metrics uncritically, and therefore incorrectly and ineffectively. Let’s take a closer look at them, the mechanisms for calculating them, and the limitations, understanding which is key to their effective use.
Stable, Predictable, Consistent (S.P.C.) Process Capability Indexes
The previous section of the discussion outlined the reasons why engineers and managers need these metrics and the circumstances typically associated with their determination. This section will present the mechanisms for determining the Cp, Cpk, Pp, and Ppk metrics and how to interpret them. The final section will address the limitations associated with these metrics and how they can be overcome, gaining not only Cp, Cpk, Pp, and Ppk values but also essential knowledge about our production processes and manufactured products.
Before we move on to the calculations, let’s define what process capability actually means. It is the range of values for a given product characteristic that we can expect over a given period of time. Therefore, a capable process is one in which the range of values for a given product characteristic falls within the specification limits [1].
Cp and Cpk metrics are metrics that, by definition, characterize the capability of a stable, consistent, and predictable process—a process like the one shown in Figure 1*.
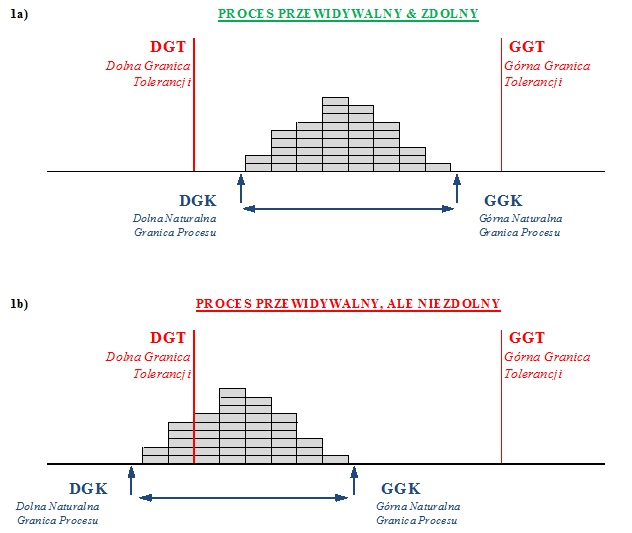
Figure 1. A predictable and capable process (1a) and a predictable but incapable process (1b)
Cp is a coefficient that characterizes the process’s variability, while Cpk characterizes its variability and position relative to the specification limits. Moving on to the mechanisms for calculating individual coefficients, let’s begin with the Cp index, which is simply a comparison of the Voice of the Customer (VOC) and the Voice of the Process (VOP). To calculate its value, divide the tolerance area—i.e., the total available area agreed to by the customer—with the necessary area for the process, which defines the distance between the natural process limits. In the case of a normal data distribution, these limits contain 99.997% of the values for a given characteristic, a given product. This relationship is shown in Figure 2.
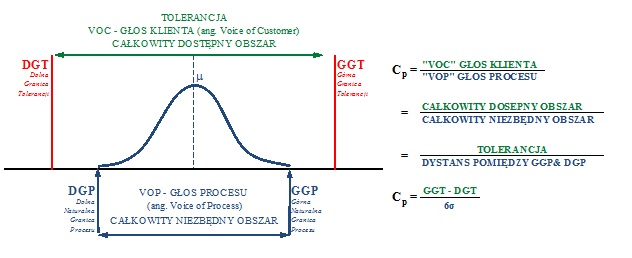
Figure 2. Graphical representation of the mechanisms for calculating the Cp index.
The situations in Figure 2 can also be visualized using the concept of a car and a garage. The question answered by the Cp index in this case is how many cars (read: processes) can we fit in the garage (read: within the specification limits). Looking at Figure 3, for the same specification limits (the same garage width), depending on the car width (process width, i.e., the variability of our process), we can park two cars (Cp = 2.0) or one car (Cp = 1.0).
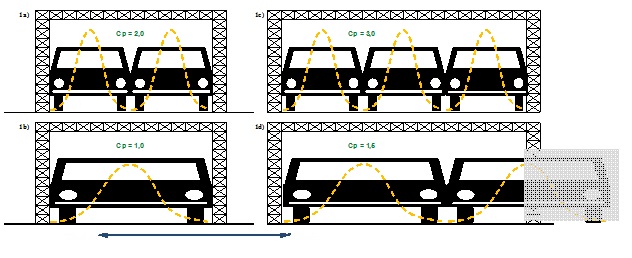
Figure 3. Graphical example of the interpretation of the Cp index.
Looking at Figure 3, it’s essential to note at least two aspects. First, even if we have Cp = 2.0 (meaning we can park two cars in the garage), we still have a small number of values (0.003%) that fall outside the specification, and analogously, we still have a chance of slightly scratching our car. Second, a more critical aspect to remember is that Cp tells us how our process is performing relative to the specification, but it doesn’t tell us where it is, as graphically presented in Figure 4. As you can see, both processes have Cp = 1.0, but are they the same? Of course not – one is located between the specification limits, and the other completely outside them. Therefore, in addition to Cp, we need something more, something that will additionally describe the position of our process relative to the tolerance limits.
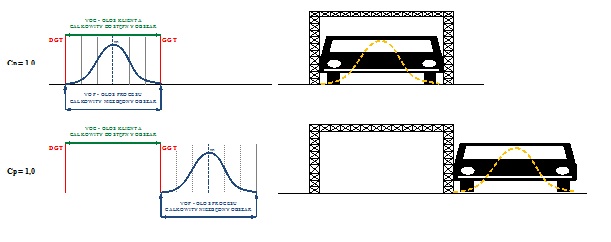
Figure 4. Graphic example of the interpretation of the Cp index
The metric that allows us to determine the position of a stable, consistent, and predictable process is Cpk. It indicates where our process is within tolerance limits by comparing the distance to the nearest specification with half the distance between the natural process limits, as shown in Figure 5.
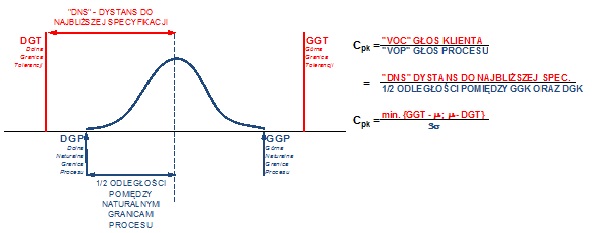
Figure 5. Mechanism for calculating the process centering index Cpk.
It’s easy to see that, conceptually, calculating and understanding process capability metrics is straightforward, and the formulas for determining Cp and Cpk values are based on simple mathematics, not complex statistics. One important element to remember is the method for calculating the standard deviation, which is necessary to determine the natural process limits. The formula to use to calculate the standard deviation (σ) for a stable, consistent, and predictable process, necessary to determine Cp and Cpk, is:
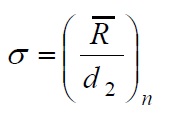
where d2 is a coefficient that takes a value depending on the size of the subgroup “n.”
Two important properties of process capability indices should also be considered:
- The Cpk value is always equal to or less than the Cp value. The same relationship will also hold for Ppk and Pp.
- In a one-sided specification, we can only calculate the Cpk and Ppk indices.
Performance Indexe for an unstable, unpredictable, and inconsistent process – Pp and Ppk
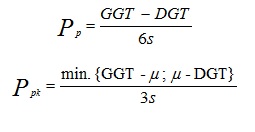
In the case of a process that is not predictable, our ability to describe it is significantly reduced. Process instability is simply the inability to predict how it will operate in the future. To calculate the Cp and Cp indices, we need a process that is stable, consistent, and predictable. It would take a significant lack of rational thinking to believe that a process that was unstable and unpredictable in the past would suddenly start behaving differently in the future. Therefore, calculating the Cp and Cpk indices is incorrect. Since Cp and Cpk do not describe the current capability of a process that is not S.P.C., some suggest calculating the Pp and Ppk indices. Their calculation is largely based on the idea that if we cannot describe the “future” of an unpredictable process in any way, we can still attempt to describe past performance for the same process[2]. The mechanisms for calculating the Pp and Ppk indices are very similar to those for the Cp and Cpk indices, the only difference being the method for calculating the standard deviation. While Cp and Cpk use a “local” index in the denominator, describing the variability within a subgroup, Pp and Ppk use a “global” index calculated based on all data collected at a given time. Therefore, the Pp and Ppk indices are calculated using the following formulas:
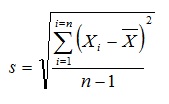
where the standard deviation value (s) is calculated according to the formula:
Nevertheless, it’s important to remember that whatever calculations we make, they won’t change the fact that the process is unpredictable, unstable, and inconsistent. This carries many limitations and implications for the interpretation of the calculated indicators.
Limitations of Process Capability Indexes
The previous chapters presented the basic mechanisms involved in calculating individual process capability indices. As usual, the construction and calculations are quite simple, making them pleasant and convenient. This is the most common stage, but the next step involves interpretation, or more precisely, interpretation taking into account the limitations of this indicator. As it turns out, the Cp & Cpk and Pp & Ppk indices have many limitations that should be kept in mind before drawing any conclusions based on them.
Process Capability Indexes are based on specification limits
This means we must reliably determine them. The word “reliable” is used here specifically because, among other things, specification limits are the voice of the customer. This means that the allowable range within which our process should operate will depend primarily on the quality of the customer requirements reflected in these limits. Let’s consider two example situations:
- A Cp and Cpk value of > 10.0 suggests that the process is excellent, and in the case of a stable process, 100% of the products are within the specification limits. However, for a given product characteristic, we experience many complaints in the end customer market. Does this mean we have reliable specifications? Leaving aside other potential reasons for this situation (e.g., changes in a given characteristic over time), of course not. The specifications do not reflect the customer’s true requirements. Consequently, the Cp and Cpk indices appear very good, and the product quality for the end customer remains poor, and we are not bothered by the fact that the indices appear more than satisfactory.
- A value of 0.1 < Cp and Cpk < 0.5 suggests that our process is incapable of meeting the given specification. However, from the perspective of the end customer, all products are very good. Can we call such specification limits reliable? If there are no other indications for maintaining such narrow specification limits, it is difficult to say that they accurately reflect the customer’s requirements, and improving the process to achieve the appropriate capability can sometimes be costly, which may impact the price of the final component.
How the data was collected to determine the process capability indexes
This is a key question not only for process capability indicators. To understand the essence of this question, imagine the stamping process of a steel component that will be mass-produced in two locations (e.g., a factory in Germany and Poland, where each factory has its own die). Each location has two presses dedicated to the production of this component. Now, suppose a customer requests the supplier’s process capability indicators for a critical characteristic of a given product. Consider two hypothetical situations:
- The component supplier collected 100 stamped components from the production process, manufactured in a single run at the Polish location, and determined the process capability indicators.
- The component supplier collected 100 components from the production process at two locations, each using a different steel coil delivery, which allowed them to collect a total of 100 components, from which they determined the process capability indicators.
Will the process capability indicators be the same in both cases? Which data collection method better reflects the true process variability? Which indicators will better reflect the process from which we receive components on a daily basis? Which information is more useful for assessing and learning about a production process? These and other questions should always be asked before drawing any conclusions about the process or product from any data. Data quality, meaning how it was collected, is always crucial. The quantity of data is important (especially in the case of process capability indicators), but its quality is critical. As in the example above, although the amount of data is equal in both cases, the quality of information about the production process in the second case is significantly greater, allowing us to describe the process of interest in a much better way.
The question remains, however, whether such an indicator actually shows us what’s happening in our processes? By collecting data effectively, we have a solid basis for identifying the problem and the greatest potential for improvement (whether it’s a location, a press, or steel supplies). Using indicators leads us to aggregate all this information into a single number.
The process capability indexes Cp and Cpk are based on the estimation of the standard deviation and the mean value for a given process
The process capability indices Cp and Cpk are a function of the specification limits, mean value, and standard deviation, and therefore of the estimated values. Therefore, the quality of the estimation of these statistics, and consequently the Cp and Cpk values, depends on the sample size from which they are calculated. To verify this, it is sufficient to continuously sample 300 components from the process and then determine Cp and Cpk values for the next 30 components. This will yield ten Cp and Cpk values. Although our process has not changed in any way (we sampled 300 components in a row), the resulting indices will not be identical. Moreover, the differences between them can be significantly different. For a sample size of n=30, the error resulting from the estimation is ≈ ± 30%, for n=200 the error is ≈ ± 10%, and for n=900 the error will be ≈ ± 5% [4]. Therefore, it is recommended to determine process capability indicators with confidence intervals, available in all statistical software.
Process capability indexes Cp and Cpk are not a substitute for using control charts
Cp & Cpk indicators become useful when our process is stable, predictable, and consistent. To determine this, we need to use control charts, which allow us to objectively separate inherent variability from abnormal variability and determine the stability of our process. Using indicators alone does not allow us to learn about the process as effectively as when using indexes as an adjunct to previously developed control charts.
The same value of the process capability index Cpk does not always indicate the same problem
The Cpk index takes into account process variability and its location and, in most cases, will tell us almost the whole truth. The word “almost” conceals the limitations listed above, but it also refers to the process’s location within the specification limits. This means that in some cases, we won’t know whether our process is closer to the lower or upper limit. The index value will be the same, but the problem will be completely different. These types of limitations are particularly important when working with multi-component assembly or when there is any need to fit multiple components together. To illustrate this problem, let’s consider an example. Figure 6a shows a process with a Cpk index of 0.66. However, looking at our process’s distribution and location relative to the specification limits, we see that it is “hugging” the lower limit of the customer’s requirements. In Figure 6b, on the other hand, the Cpk index is 0.66, but the process is located somewhere completely different, this time at the upper limit.
So the fact that it is bad, because the Cpk is at the level of 0.66, is already some information, but it is also necessary to add from which side it is so bad and what threats it may carry.
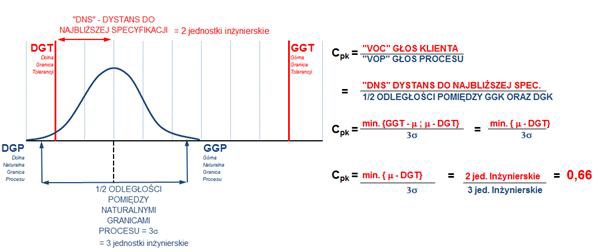
Rysunek 6a. Dwuznaczność wskaźnika Cpk.
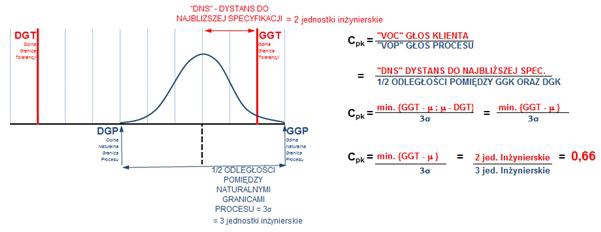
Rysunek 6b. Dwuznaczność wskaźnika Cpk.
To summarize the discussion regarding process capability indicators, it must be said that they are undoubtedly dangerous indicators if we are unaware of their limitations and therefore use them indiscriminately. Cp and Cpk indices can and should be used as a supplement to other elements. Using them incorrectly will lead to false conclusions, incorrect actions, and consequently, degraded process and product performance, resulting in general frustration and helplessness. Therefore, a checklist can be helpful, indicating the elements that must be met before Cp and Cpk can be determined, although critical thinking is essential here as well:
Do we have reliable tolerances?
- Is the measurement system adequate
- Analysis of the measurement system.
- Source data and histogram
- How was the data collected? Was the true process variability captured?
- Is the process stable, predictable, and consistent?
- Control charts.
- What is the sample size used to determine the process capability indicators? Confidence Intervals.
- Cp & Cpk
Completing all the steps in this checklist will significantly improve the quality of the indicator, which significantly impacts the conclusions drawn from its interpretation and, consequently, the actions taken.
We hope that the next time someone asks about the Cp and Cpk indicators, before the barrage of actions begins, you’ll ask about the measurement system, stability, sampling plan, etc., just to be sure. Once all this is on your desk, only then should you look at this magical and “only” indicator of process capability. But will it even be necessary then?
Literature:
[1] Donald J. Wheeler, The Six Sigma Practitioner’s Guide to Data Analysis, SPC Press 2010
[2] Donald J. Wheeler, Beyond Capability Confusion, SPC Press 2010
[3] Paul Keller, Is Your Process Performing?, Quality Software & Analysis, April 2011
[4] Mark L. Crossley, Size Matters, How good is your Cpk, really?, Quality Digest Magazine, 2000.
* Of course, process stability was previously assessed based on control charts (this is not possible based solely on a histogram), which did not show any trends or patterns that would indicate the presence of special variability in the process. This, in turn, would not allow us to conclude that the process is stable, predictable, and consistent.
Have questions, thoughts, or something that particularly piques your interest? Join the discussion below on our LinkedIn post. Follow us to stay up to date.